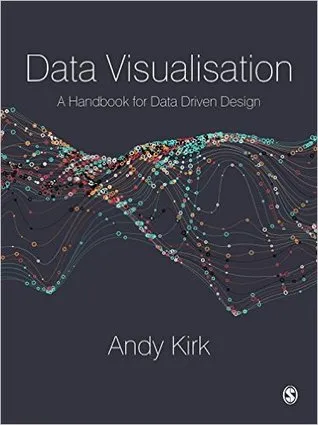
Data Visualisation: A Handbook for Data Driven Design
4.5
Reviews from our users

You Can Ask your questions from this book's AI after Login
Each download or ask from book AI costs 2 points. To earn more free points, please visit the Points Guide Page and complete some valuable actions.Related Refrences:
Introduction to "Data Visualisation: A Handbook for Data Driven Design"
"Data Visualisation: A Handbook for Data Driven Design" is much more than a textbook or technical manual; it is a comprehensive guide crafted to empower readers with the tools, mindset, and principles necessary to create impactful and effective data visualizations. Authored by Andy Kirk, this book is a vital resource for everyone from beginners eager to learn the foundations of visualization design to seasoned professionals looking to refine their craft. In an age dominated by data-driven decision-making, the ability to convey insights clearly and attractively has never been more important, and this book equips you with the expertise to do so.
Through this book, I aim to systematically demystify the process of visual storytelling, providing a structured approach that bridges the gap between data analysis and communication. By blending practical advice, theoretical depth, and an engagingly accessible narrative style, this work is suited for anyone who wishes to better understand and utilize the powerful intersection of data and design.
Detailed Summary of the Book
The book is divided into a thoughtful structure that reflects the journey of crafting a data visualization, from the initial discovery and exploration of data to the final stages of design and communication.
The core framework of the book revolves around the “Design Process,” an approach that helps readers navigate the many facets of creating visualizations. These phases include:
- 1. Formulating Purpose: Understanding the "why" behind your visualization, its intended audience, and its goals.
- 2. Working with Data: Delving into data collection, exploration, cleaning, and preparation.
- 3. Editorial Thinking: Learning to prioritize insights, filter key messages, and create meaningful narratives.
- 4. Creative Design: Exploring the typography, colors, charts, and layout techniques that bring data to life visually.
- 5. Constructing the Visual: Practical implementation and refinement of your visualization, ensuring clarity and accuracy.
Each chapter builds thoughtfully, offering actionable guidance without becoming overly prescriptive. Tools, frameworks, and real-world examples are peppered throughout the text, showing how complex datasets can be transformed into intuitive and compelling narratives. Whether you're crafting dashboards, static graphics, or interactive experiences, the insights shared in this book can be adapted to various contexts.
Key Takeaways
"Data Visualisation: A Handbook for Data Driven Design" is packed with knowledge and practical advice. Some key takeaways include:
- A clear understanding of the five-stage Design Process for effective visualization creation.
- The importance of audience-driven design: putting the needs of your viewers first.
- Best practices for chart selection and how to avoid common visualization pitfalls.
- The role of aesthetics in enhancing understanding and engagement with data.
- Practical strategies for working with messy data and storytelling through visuals.
By the end of the book, you'll be equipped not just with technical know-how, but also the creative confidence to tackle even the most complex data challenges.
Famous Quotes from the Book
"The goal of data visualization is not to impress with complexity, but to express with clarity."
"Design is not just about how something looks, but about how effectively it communicates."
"Data visualization sits at the intersection of art and science, requiring both imagination and rigor."
Why This Book Matters
In our modern world, data visualization has become indispensable. From business analytics to policymaking, education to journalism, the ability to visually translate datasets into actionable insights is transformative. "Data Visualisation: A Handbook for Data Driven Design" fills a critical gap in this landscape by offering a comprehensive guide that is both technically actionable and conceptually enlightening. It empowers readers not only to learn but to think critically about the process of design innovation.
Whether you're a data analyst, a designer, or simply someone passionate about storytelling through visuals, the lessons imparted in this book have a lasting impact. It emphasizes clarity, accessibility, and the thoughtful design principles that prioritize audience understanding above everything else. This makes it an invaluable resource for those seeking to bridge the gap between raw data and actionable knowledge.
As you navigate through its pages, you'll discover a philosophy that encourages experimentation and embraces creativity while never losing sight of the ultimate goal: communication. This work has emerged as a cornerstone of the field, shaping how professionals approach visualization today.
Free Direct Download
You Can Download this book after Login
Accessing books through legal platforms and public libraries not only supports the rights of authors and publishers but also contributes to the sustainability of reading culture. Before downloading, please take a moment to consider these options.
Find this book on other platforms:
WorldCat helps you find books in libraries worldwide.
See ratings, reviews, and discussions on Goodreads.
Find and buy rare or used books on AbeBooks.
