
Practical Statistics for Data Scientists: 50 Essential Concepts
Peter Bruce,Andrew Bruce
2017
View book
Book guide and evaluation
Nadieh Bremer;Shirley Wu
0 reviews
Published
pages
views
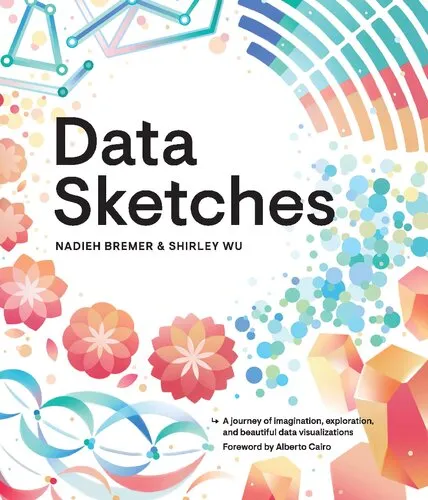
Introduction to “Data Sketches: A Journey of Imagination, Exploration, and Beautiful Data Visualizations” In a world increasingly driven by data, storytelling through thoughtful and creative visual design has become more essential than ever. “Data Sketches: A Journey of Imagin
Before you read
In a world increasingly driven by data, storytelling through thoughtful and creative visual design has become more essential than ever. “Data Sketches: A Journey of Imagination, Exploration, and Beautiful Data Visualizations” combines the technical precision of data visualization with the artistic flair of personal storytelling. Written by Nadieh Bremer and Shirley Wu, two globally renowned data visualization experts, the book takes readers through their year-long collaboration and personal exploration of data-driven creativity. With a balance of technical insights, conceptual storytelling, and stunningly original design, this book is an inspiring resource for designers, coders, and anyone interested in the artistry of data.
The book explores the journey of two talented creators, Nadieh Bremer and Shirley Wu, as they challenge themselves to create one creative, data-driven visualization each month for an entire year. Each chapter of Data Sketches is organized around a monthly theme, such as "Movies," "Music," "Nature," or "Culture," and encapsulates the unique process that both authors undertook to create their visualizations.
The book blends professionalism and passion, offering an honest glimpse into the creative and technical challenges experienced by both authors. Each chapter delves into their workflows: from brainstorming ideas, collecting and cleaning data, choosing tools and technologies, and ultimately bringing their visions to life in the form of memorable and beautifully crafted visualizations. Nadieh and Shirley openly share code snippets, design choices, and the moments of iteration and experimentation that shaped their work.
What makes Data Sketches particularly distinguished is its emphasis on the dual perspectives of the authors. While their processes share common threads, their unique styles, inspirations, and technical approaches serve as a compelling framework for showcasing the breadth and diversity of the data visualization field. The final result is not only a celebration of visual creativity but also a valuable learning resource for anyone seeking to deepen their understanding of how technical execution and artistic vision can harmonize.
"Data can be beautiful, artistic, and emotional—it can tell stories that make us curious, engaged, and sometimes even surprised by what we discover."
"Visualization isn’t just about the numbers; it’s also about connecting with the audience on a human level that leaves a lasting impression."
"The hardest part of creativity isn’t the execution—it’s the self-belief that you can achieve something greater than your doubts."
In a digital ecosystem that sees an overwhelming influx of data, the ability to create meaningful and emotional connections through data visualization is more crucial than ever. “Data Sketches” stands apart because it does not shy away from combining precision with personality, computation with creativity, and storytelling with structure.
Nadieh Bremer and Shirley Wu’s collective experience and open sharing of their methods provide aspiring data visualizers with both inspiration and practical tools. Moreover, their collaborative approach highlights how diverse perspectives enrich the creative journey. Everyone from data analysts to designers can learn how to break traditional molds and engage audiences more effectively with thoughtful storytelling.
What truly makes this book matter is its broader message—data is more than just numbers. It’s a medium to evoke emotion, provoke thought, and inspire action. In an age where data literacy is increasingly essential, Data Sketches empowers readers to approach information not just as analysts but as curious storytellers.
Your question is answered in the context of this title and author. Each answer uses 2 points.
0 reviews, 4.8 average out of 5
Sign in to publish a review.
Ask a focused question and learn from the community.
Related references that continue this learning path.
Peter Bruce,Andrew Bruce
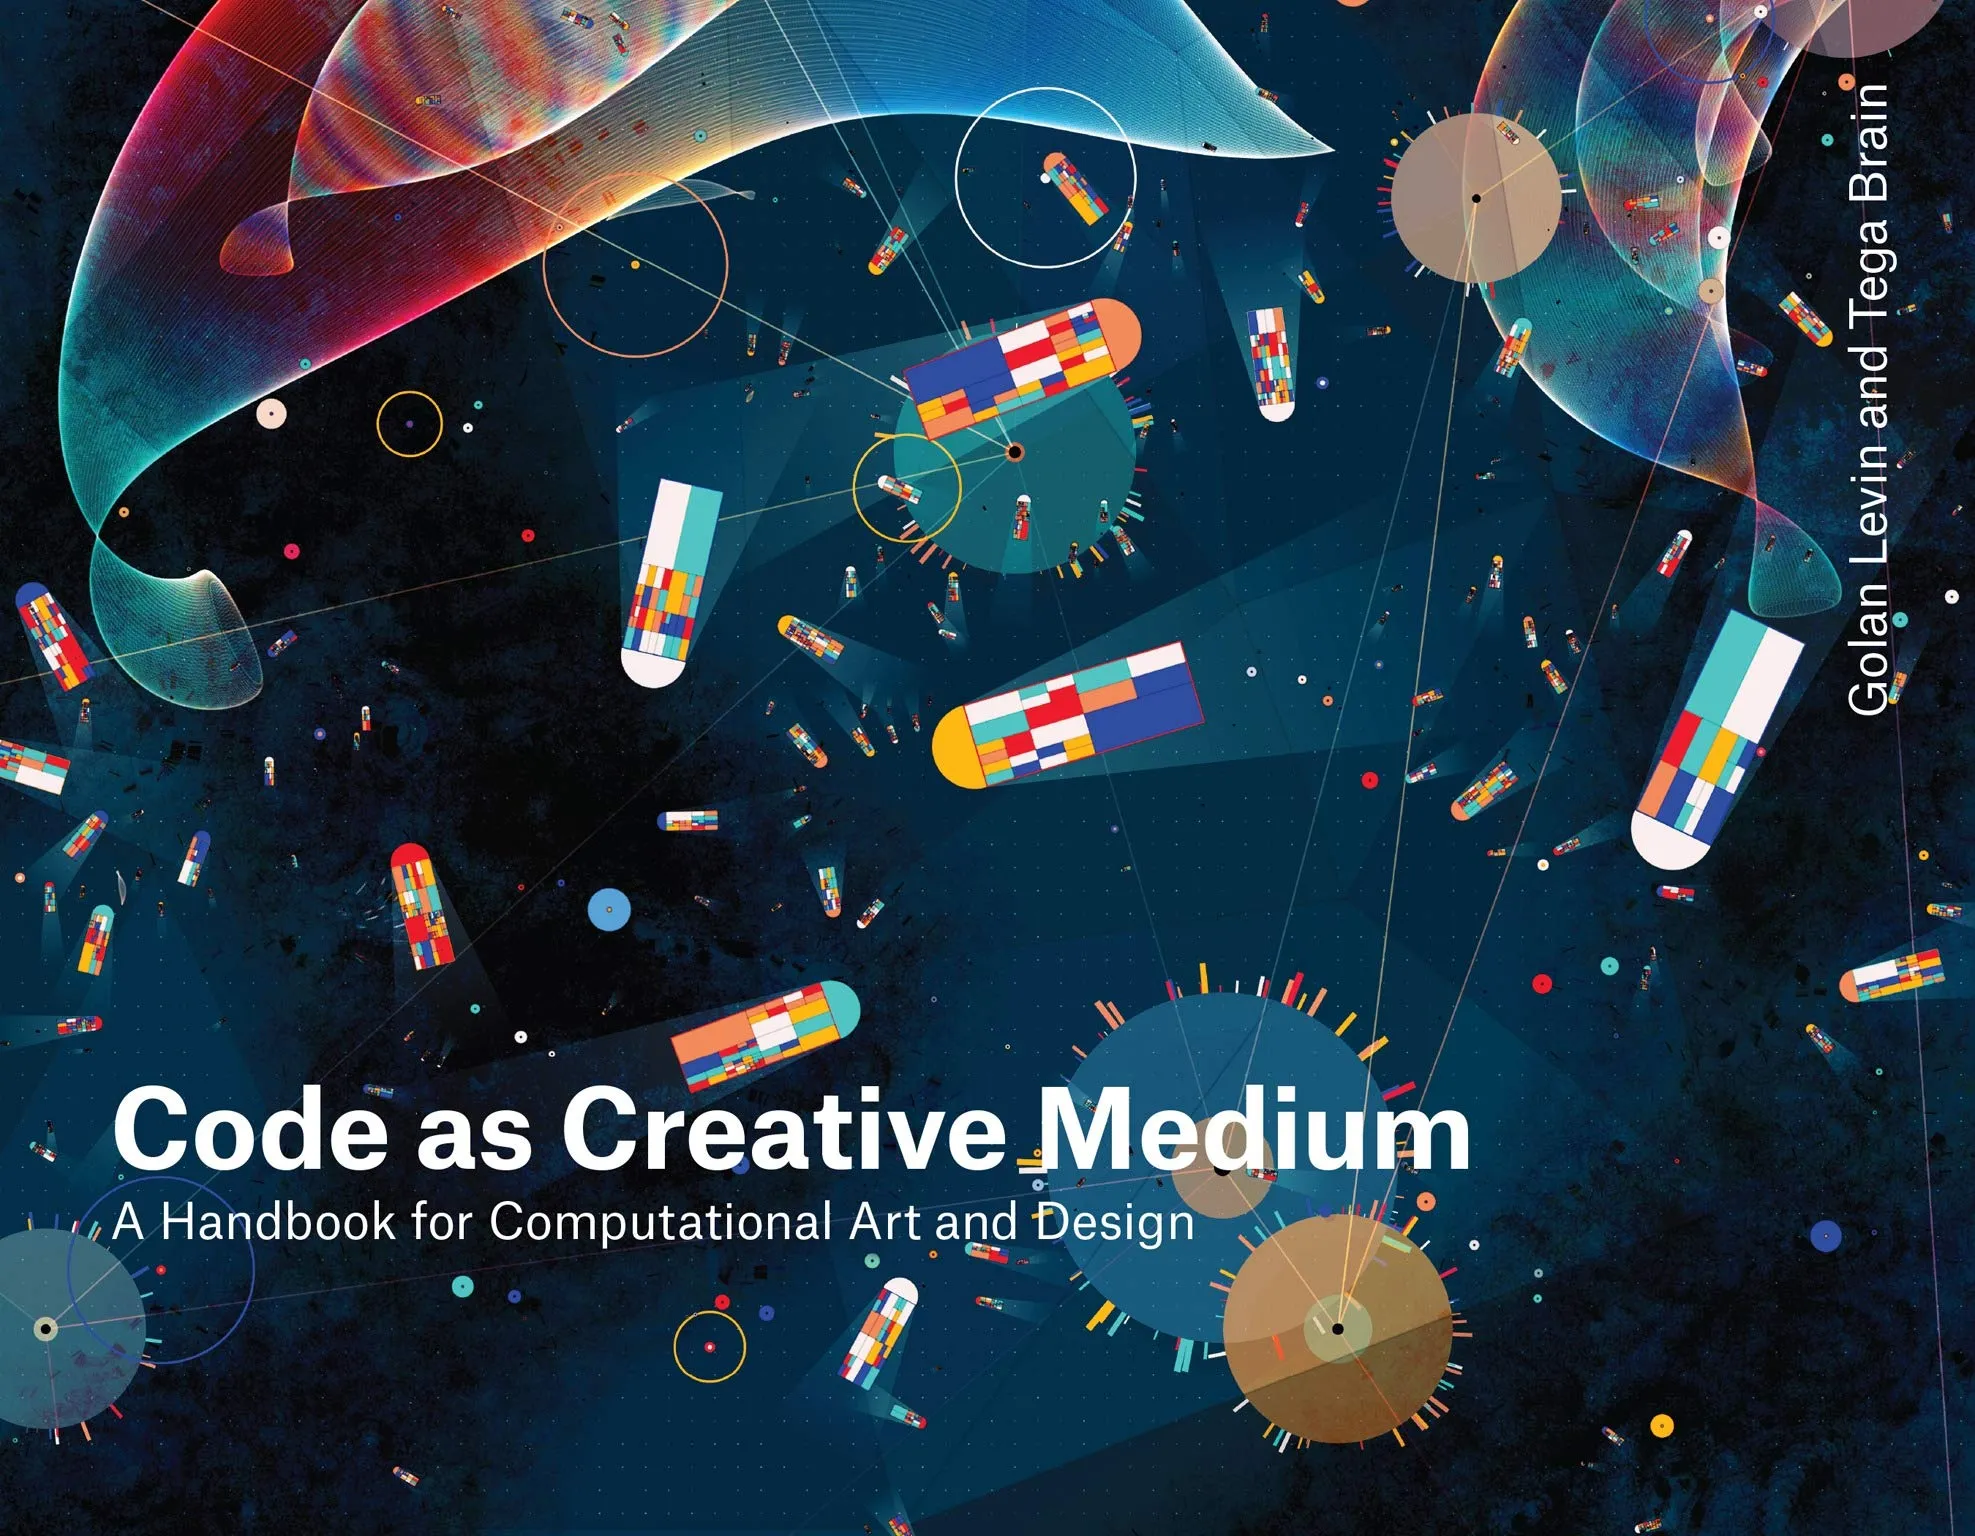
Golan Levin;Tega Brain

Philippe O'Connor