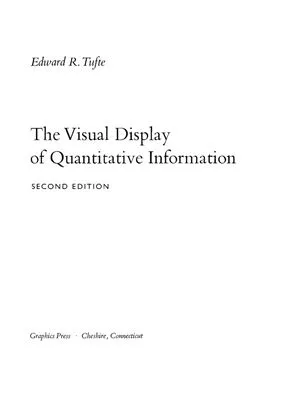
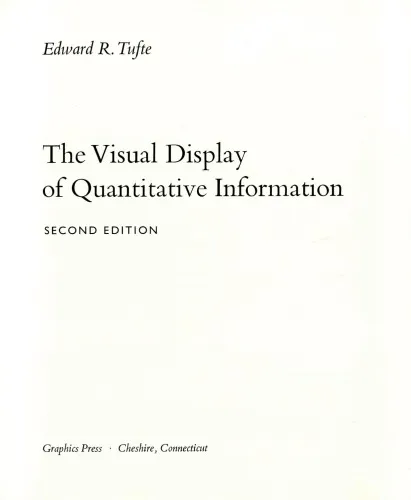
The Visual Display of Quantitative Information (2ed)
4.7
Reviews from our users

You Can Ask your questions from this book's AI after Login
Each download or ask from book AI costs 2 points. To earn more free points, please visit the Points Guide Page and complete some valuable actions.Related Refrences:
Introduction
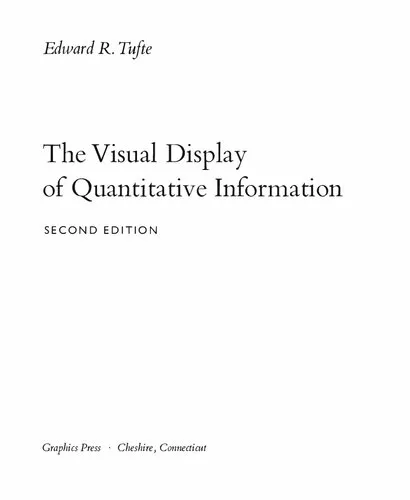
Welcome to the world of data visualization, a realm where numbers transform into visual stories that not only inform but also captivate. "The Visual Display of Quantitative Information (2nd Edition)" by Edward R. Tufte is a seminal work that redefines how we perceive and present data.
Detailed Summary of the Book
At the heart of "The Visual Display of Quantitative Information" lies the pursuit of clarity and precision in communicating data. The book is not just about creating charts and graphs; it’s about understanding the principles that govern effective visual storytelling. The second edition builds upon the foundation laid by the original, presenting additional insights, refined ideas, and expanded context to accommodate an evolving field.
Through a rich tapestry of historical examples and contemporary applications, Tufte provides a meticulous examination of the design complexities in quantitative visualization. The book delves into the theory and practice of data graphics, emphasizing the importance of integrity and transparency in data representation. Tufte illustrates how graphical excellence involves conveying complex ideas with clarity, precision, and efficiency.
The second edition comprises improved typography, updated examples, and a fresh perspective on some classic data displays. The book criticizes overly complex designs and emphasizes minimalist approaches that bring out the essence of data without unnecessary embellishment.
Key Takeaways
Data-Ink Ratio: One of Tufte’s fundamental concepts is the data-ink ratio, which suggests maximizing the proportion of ink devoted to the non-redundant display of data and minimizing the non-essential ink.
Graphical Integrity: Tufte stresses the importance of truthful representation, advocating against distorted or misleading graphics that misinterpret the data’s message.
Aesthetic Elegance: While functionality is paramount, Tufte argues for designs that are also aesthetically pleasing, drawing on principles of balance, proportion, and harmony.
Contextual Reference: Highlighting the need for context, Tufte instructs designers to provide necessary reference points that aid accurate interpretation of data graphics.
Famous Quotes from the Book
“Graphical excellence is the well-designed presentation of interesting data — a matter of substance, of statistics, and of design.”
“Above all else show the data.”
“The greatest value of a picture is when it forces us to notice what we never expected to see.”
Why This Book Matters
In an era saturated with data, the ability to discern and convey information compellingly has never been more crucial. Tufte's work goes beyond instructional guiding; it presents a philosophy of design that echoes throughout modern fields such as data science, journalism, finance, and academia.
The principles advocated in this book hold a timeless relevance, influencing professionals who are tasked with making sense of complex data landscapes. By demonstrating how insightful visualization can lead to clearer understanding, Tufte empowers readers to transform raw data into enlightening narratives. His ideas continue to inspire, fostering a culture of excellence and responsibility in visual communication.
Whether you are a seasoned data analyst, a designer, or simply someone passionate about the art of data presentation, "The Visual Display of Quantitative Information" serves as both a foundational text and a source of enduring inspiration. It elevates data graphics from mere technicality to an art form, underscoring the impact that well-crafted visuals can have on comprehending our world.
Free Direct Download
You Can Download this book after Login
Accessing books through legal platforms and public libraries not only supports the rights of authors and publishers but also contributes to the sustainability of reading culture. Before downloading, please take a moment to consider these options.
Find this book on other platforms:
WorldCat helps you find books in libraries worldwide.
See ratings, reviews, and discussions on Goodreads.
Find and buy rare or used books on AbeBooks.
1430
بازدید4.7
امتیاز0
نظر98%
رضایتReviews:
4.7
Based on 0 users review
Questions & Answers
Ask questions about this book or help others by answering
No questions yet. Be the first to ask!



![Data Mining Concepts and Techniques [Solution Manual]](https://s3.refhub.ir/images/thumb/Data_Mining_Concepts_and_Techniques__Solution_9192.webp)


