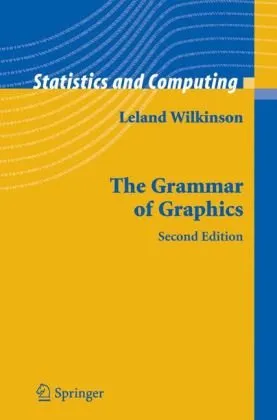
Mathematical foundations of scientific visualization, computer graphics, and massive data exploration
4.5
Reviews from our users

You Can Ask your questions from this book's AI after Login
Each download or ask from book AI costs 2 points. To earn more free points, please visit the Points Guide Page and complete some valuable actions.Related Refrences:
Introduction
Welcome to "Mathematical Foundations of Scientific Visualization, Computer Graphics, and Massive Data Exploration"—a pivotal work at the intersection of mathematics, computer science, and data analytics. This book serves as both a comprehensive guide and a foundational reference for scholars, researchers, and practitioners who aim to leverage the power of mathematical principles in visualizing complex information. By deeply exploring theoretical and application-driven concepts, this book provides solutions to some of the most pressing visual and analytical challenges in the modern era of massive datasets and intricate graphical design.
Drawing from years of academic research and real-world application, the authors skillfully weave advanced mathematical theories with practical methods to address the growing demand for effective tools in scientific visualization and data exploration. If you are a student, professional, or researcher in fields such as computer graphics, data visualization, computational science, or machine learning, this book offers a framework for understanding and applying mathematical techniques to explore and present data in meaningful ways.
Detailed Summary of the Book
What does this book cover?
The book delves into a wide variety of topics, including but not limited to geometrical modeling, computational topology, interpolation techniques, and advanced rendering algorithms. It is divided into multiple sections, each addressing a unique area of focus within scientific visualization, computer graphics, and massive data handling.
A significant portion of the book discusses the mathematical frameworks that underpin computer graphics and data analysis, such as linear algebra, numerical methods, and differential geometry. These are presented alongside practical algorithms that can enable readers to implement their ideas in programming environments.
Key discussions include the mathematical basis for creating visualizations of multidimensional data, methods for reducing complexity in massive datasets, and innovations in rendering techniques to support realistic and informative graphics. Additionally, the book emphasizes the importance of maintaining accuracy and efficacy in visualizations to drive better insights in scientific and industrial domains.
To ensure accessibility for readers across skill levels, the authors strike a balance between theory and application. Advanced concepts are interwoven with step-by-step implementation strategies, illustrative examples, and case studies that elucidate their practicality.
Key Takeaways
Why should you read this book?
- Gain a deep understanding of the mathematics behind scientific visualization and computer graphics.
- Learn to create effective data visualizations using sound mathematical principles.
- Master algorithms and techniques for rendering complex graphics and massive datasets.
- Acquire the skills to solve real-world problems in computational science and data analytics.
- Explore the integration of theoretical knowledge with practical applications.
Famous Quotes from the Book
Here are some profound insights from the authors:
"Visualization is not merely a method to represent data; it is a fusion of science and art that enables understanding."
"The efficacy of a visualization depends not just on how it looks, but on how faithfully it represents and communicates underlying data."
"Mathematics is the canvas upon which we paint the complexities of the world; effective graphics and visualizations transform these paintings into stories we can understand."
Why This Book Matters
What makes this book a vital resource?
In a world driven by data, the ability to visualize information effectively is an invaluable skill. Whether it's in scientific research, engineering, healthcare, or business, the capacity to distill meaning from massive datasets through visualization has become increasingly vital. This book equips readers with the theoretical backbone and practical tools necessary to excel in this domain.
The text is more than just a collection of algorithms or methodologies; it is a roadmap for bridging the gap between abstract data and actionable insights. By emphasizing the role of mathematical rigor in visualization, the authors provide a foundation that ensures the work of practitioners is grounded in precision and clarity.
Furthermore, as datasets grow larger and more complex, efficient exploration and manipulation techniques become indispensable. This book empowers readers to tackle these challenges with innovative ideas that combine computational efficiency with visual impact. The principles and frameworks discussed herein will remain relevant and powerful as we continue to expand the frontiers of scientific exploration and knowledge representation.
Free Direct Download
You Can Download this book after Login
Accessing books through legal platforms and public libraries not only supports the rights of authors and publishers but also contributes to the sustainability of reading culture. Before downloading, please take a moment to consider these options.
Find this book on other platforms:
WorldCat helps you find books in libraries worldwide.
See ratings, reviews, and discussions on Goodreads.
Find and buy rare or used books on AbeBooks.
1317
بازدید4.5
امتیاز0
نظر98%
رضایتReviews:
4.5
Based on 0 users review
Questions & Answers
Ask questions about this book or help others by answering
No questions yet. Be the first to ask!


![The Mathematical Experience [Study Edn.]](https://s3.refhub.ir/images/thumb/The_Mathematical_Experience__Study_Edn_16194.webp)

![Good Charts, Updated and Expanded: The HBR Guide to Making Smarter, More Persuasive Data Visualizations [Team-IRA]](https://s3.refhub.ir/images/thumb/Good_Charts__Updated_and_Expanded__The_HBR_Gu_31517.webp)
