- Published Year: 2017
- Page count: 135
- File Size: 28 MB
- Language: English
- Published by: Amazon Digital Services
- Visited by: 285
- Rating/Review: 5.0
- ISBN: ISBN information not found.
Keywords:
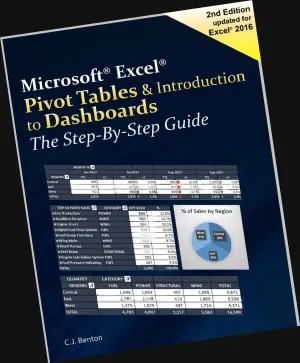
Excel Pivot Tables & Introduction To Dashboards. The Step-By-Step Guide
5.0
Reviews from our users

You Can Ask your questions from this book's AI after Login
Each download or ask from book AI costs 2 points. To earn more free points, please visit the Points Guide Page and complete some valuable actions.


This book can be used as a tutorial or quick reference guide. It is intended for users who are comfortable with the basics of Microsoft Excel and are now ready to build upon this skill by learning Pivot Tables and Dashboards. This book assumes you already know how to create, open, save, and modify an Excel® workbook and have a general familiarity with the Excel toolbar (Ribbon). Updated for Microsoft Excel 2016! This book contains easy to follow step-by-step examples with screenshots demonstrating how to create Pivot Tables and basic Dashboards. In just a few short hours, you’ll learn how to: Organize and summarize data Format & filter Pivot Table results Create Pivot Charts Display averages & percentages Group data into predefined ranges Use Slicers Rank results Apply calculated fields Create Pivot Table reports from imported files And more! In addition to the above, you will also learn how to create, format, and update a basic Dashboard using Pivot Table data. Including how to incorporate charts and performance symbols into your reporting. A great resource for: Business Analysts Data Analysts Financial Analysts Administrative and Support staff Imagine the time youll save by not having to search the internet or help files to learn the most practical ways of using one of Microsoft Excel’s best features!
Free Direct Download
You Can Download this book after Login
Accessing books through legal platforms and public libraries not only supports the rights of authors and publishers but also contributes to the sustainability of reading culture. Before downloading, please take a moment to consider these options.
Find this book on other platforms:
WorldCat helps you find books in libraries worldwide.
See ratings, reviews, and discussions on Goodreads.
Find and buy rare or used books on AbeBooks.

1285
بازدید5.0
امتیاز0
نظر98%
رضایتReviews:
5.0
Based on 0 users review
Questions & Answers
Ask questions about this book or help others by answering
Please login to ask a question
No questions yet. Be the first to ask!