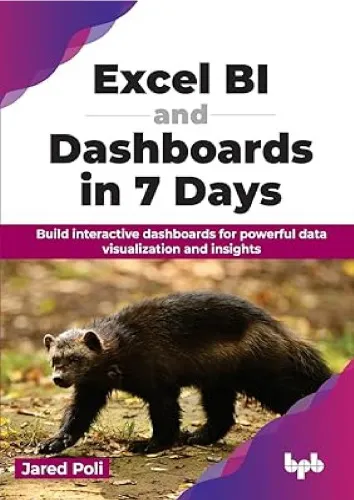
Excel BI and Dashboards in 7 Days: Build interactive dashboards for powerful data visualization and insights
4.9
Reviews from our users

You Can Ask your questions from this book's AI after Login
Each download or ask from book AI costs 2 points. To earn more free points, please visit the Points Guide Page and complete some valuable actions.Related Refrences:
Using MS Excel for powerful exploration, manipulation, and data visualizationKey Features● A deep dive into dashboarding in Excel, understanding the opportunities and limitations of Excel as a BI solution.● Guiding the reader to understand more about data requests and the stakeholders that make them.● Transform data into clear information and actionable insights for informed decisions.DescriptionEveryone thinks of Excel differently, and its full potential is often untapped. Businesses tend to decide to invest heavily in proper BI tools, perhaps wrongfully assuming that Excel has a minimal role in that industry.Excel can be used effectively to collect, refresh, transform, and visualize your data in beautiful and eye-catching ways. This book covers building those skills and unlocking Excel and your potential in just seven days. The book explores the process of cleaning your data to ensure accuracy, using formulas to enhance and prepare the[...]same for PivotTables. It will also help you understand how to use data visualization to create clear charts to communicate insights effectively and construct interactive dashboards for user exploration, including elements like slicers and timelines. The book also dives into discovering design principles for easy-to-understand dashboards, while gaining knowledge on maintaining and updating them for ongoing usability.Understanding the full power behind Excel will allow you to improve your spreadsheet game and prove that you can do it all with one industry standard tool and this book.What you will learn● Better spreadsheet control using conditional formatting, data validation, useful shortcuts, and flash file.● How to aggregate your data with PivotTables, basic aggregation formula, and advanced aggregation formula.● Slicers, data validation dropdowns to control the page and getting your end user control.● Visualize your data by drawing a chart, making it look good, and building a dashboard page.● Power Query data refreshing and best practices for maintaining your work.Who this book is forThis book is for everyone who wants to be a powerful user of Excel, finance teams, sales and marketing teams, MIS Analysts, BI aspirants, and all those who work with Excel sheets daily and want to refine that skill set into something more practical.
Free Direct Download
You Can Download this book after Login
Accessing books through legal platforms and public libraries not only supports the rights of authors and publishers but also contributes to the sustainability of reading culture. Before downloading, please take a moment to consider these options.
Find this book on other platforms:
WorldCat helps you find books in libraries worldwide.
See ratings, reviews, and discussions on Goodreads.
Find and buy rare or used books on AbeBooks.
1223
بازدید4.9
امتیاز0
نظر98%
رضایتReviews:
4.9
Based on 0 users review
Questions & Answers
Ask questions about this book or help others by answering
Please login to ask a question
No questions yet. Be the first to ask!
