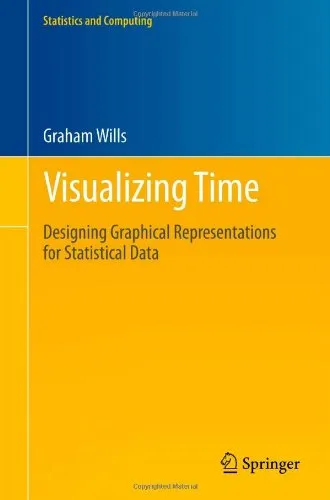
Visualizing Time: Designing Graphical Representations for Statistical Data
4.0
Reviews from our users

You Can Ask your questions from this book's AI after Login
Each download or ask from book AI costs 2 points. To earn more free points, please visit the Points Guide Page and complete some valuable actions.Introduction to "Visualizing Time: Designing Graphical Representations for Statistical Data"
"Visualizing Time: Designing Graphical Representations for Statistical Data" is a comprehensive guide for anyone looking to effectively represent temporal data through visuals. Authored by Graham Wills, this book explores the art and science of creating time-focused graphical representations that are both insightful and aesthetically engaging. Through its structured approach, the book demonstrates how to analyze complex time-dependent datasets and best practices for presentation. Readers gain a wealth of knowledge covering theoretical concepts, practical applications, and innovative techniques for designing time-based data visualizations.
A Detailed Summary of the Book
This book delves deeply into the realm of data visualization, with a particular focus on depicting temporal patterns. Time is one of the most critical dimensions in understanding data trends and their evolution, making its graphical representation a core skill for statisticians, designers, and analysts. The author provides a step-by-step path to design visualizations that are tailored to temporal data while considering critical characteristics like order, granularity, and frequency.
From traditional approaches such as line graphs and bar charts to more complex visualizations like time glyphs and spiral plots, the book explains the strengths and weaknesses of various techniques. It also highlights when to use certain methods for optimal communication. Examples include everything from daily stock market trends to decades-long climate change data.
Readers also benefit from practical case studies and coding exercises, where they can put the theories into action. The book complements technical detail with an emphasis on storytelling — teaching you how to craft a narrative through visuals so that your data resonates with audiences.
Key Takeaways
- A deep understanding of temporal data and its unique challenges in visualization.
- Mastery of a variety of methodologies for creating time-dependent graphics.
- Guidelines for matching visualization techniques to the specific type of time data you have, such as periodic, sequential, or irregular data.
- Real-world applications of statistical theory in graphic design.
- The importance of storytelling in data visualization, especially when displaying time series data.
Famous Quotes from the Book
"Time is the thread that connects all data together. Without it, we lose our sense of context, history, and progression."
"A well-designed time visualization reveals not just the obvious trends but also the subtle shifts that shape the narrative."
"Clarity should always triumph over complexity. Simpler graphics often carry more weight than intricate designs."
Why This Book Matters
In a world where vast amounts of temporal data are generated every second, the ability to effectively visualize time is an invaluable skill. Whether you're a data analyst, business leader, academic researcher, or designer, "Visualizing Time" equips you with cutting-edge tools and methodologies to decode temporal trends and present them compellingly.
Many books focus on general data visualization, but few offer such specific attention to the intricacies of time representation. The author's detailed guidance ensures that you don't just create visually appealing graphs but also ones that are meaningful and impactful. With its balance of theoretical grounding and practical advice, this book is essential reading for anyone working with time data.
Free Direct Download
Get Free Access to Download this and other Thousands of Books (Join Now)
For read this book you need PDF Reader Software like Foxit Reader
Accessing books through legal platforms and public libraries not only supports the rights of authors and publishers but also contributes to the sustainability of reading culture. Before downloading, please take a moment to consider these options.
Find this book on other platforms:
WorldCat helps you find books in libraries worldwide.
See ratings, reviews, and discussions on Goodreads.
Find and buy rare or used books on AbeBooks.


