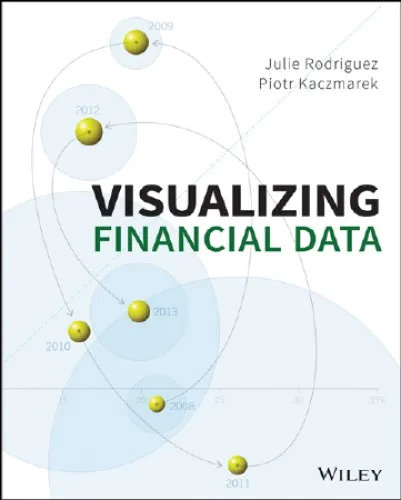
Visualizing Financial Data
4.5
Reviews from our users

You Can Ask your questions from this book's AI after Login
Each download or ask from book AI costs 2 points. To earn more free points, please visit the Points Guide Page and complete some valuable actions.Related Refrences:
Welcome to the world of financial data visualization! In our book, Visualizing Financial Data, we open the door to mastering the art and science of turning complex financial data into compelling visual narratives. This introduction is designed to provide you with a clear understanding of what the book offers, why it matters, and how it can transform the way you approach financial storytelling.
A Detailed Summary of the Book
Visualizing Financial Data is a comprehensive guide crafted to help financial analysts, data scientists, business professionals, and decision-makers unlock the power of data visualization in the world of finance. The book bridges the gap between raw data and actionable insights, ensuring that you can present financial information in ways that resonate with any audience, whether they're seasoned investors, stakeholders, or broader teams.
Throughout the book, we emphasize the principles of clarity, precision, and effectiveness in visual storytelling. You'll learn foundational concepts such as selecting the right chart types, understanding how human perception influences interpretation, and tailoring your visualizations to the needs of specific audiences. As you progress, we guide you through advanced topics such as interactive dashboards, integrating storytelling techniques, and harnessing tools to create dynamic visuals.
Drawing from real-world case studies, the book provides practical insights into avoiding common pitfalls and adhering to best practices. You'll gain hands-on strategies for working with large datasets, formatting complex reports, and ensuring compliance with financial industry standards. By the end, you’ll not only know how to create visually appealing charts and reports but also communicate the insights that drive key decisions confidently.
Key Takeaways
- Understand the foundational principles of financial data visualization.
- Master the use of effective charts, graphs, and dashboards tailored for financial reporting.
- Learn how to connect visual design choices with the psychology of your audience for higher impact.
- Discover tools, techniques, and technologies for creating interactive and dynamic visuals.
- Avoid common errors in data representation and ensure ethical clarity in your work.
- Apply practical knowledge through real-world case studies and industry-wide examples.
These takeaways are designed to empower you, regardless of your background or prior experience with data visualization tools. By focusing on both theory and application, this book ensures that you’re well-equipped to bring clarity and insight to any financial dataset.
Famous Quotes from the Book
"Data is only as powerful as the story we tell with it. In finance, where precision and trust are paramount, effective visualization can mean the difference between decision-making and decision-misleading."
"Complexity is inevitable in financial data, but confusion is not. The art of visualization lies in bridging complexity with clarity."
"Numbers tell us what. Visuals tell us why and how."
Why This Book Matters
The financial world thrives on data. Whether it's a stock chart, a revenue report, or risk management analysis, numbers are at the core of every decision. However, the challenge lies in making these numbers understandable, accessible, and actionable to diverse audiences. This is where Visualizing Financial Data makes an impact.
In today’s data-driven era, where businesses and markets navigate through massive amounts of information daily, a strong emphasis on effective data visualization is no longer optional—it's essential. This book equips you with the knowledge to stand out as a professional who not only knows their data but also knows how to make it resonate with others.
Whether you're a finance professional looking to create more engaging presentations, a data scientist bridging financial analytics with visual representation, or a decision-maker who relies on concise insights, this book provides the concrete skills and actionable examples to make you more effective. With our years of experience in both financial domains and data visualization practices, we've tailored this guide to serve as your trusted resource.
Together, we can redefine how financial data is communicated and ensure that every visualization you create informs, persuades, and inspires.
Free Direct Download
You Can Download this book after Login
Accessing books through legal platforms and public libraries not only supports the rights of authors and publishers but also contributes to the sustainability of reading culture. Before downloading, please take a moment to consider these options.
Find this book on other platforms:
WorldCat helps you find books in libraries worldwide.
See ratings, reviews, and discussions on Goodreads.
Find and buy rare or used books on AbeBooks.
1370
بازدید4.5
امتیاز0
نظر98%
رضایتReviews:
4.5
Based on 0 users review
Questions & Answers
Ask questions about this book or help others by answering
No questions yet. Be the first to ask!
