Visualizing Data
4.4
Reviews from our users

You Can Ask your questions from this book's AI after Login
Each download or ask from book AI costs 2 points. To earn more free points, please visit the Points Guide Page and complete some valuable actions.Related Refrences:
Introduction to Visualizing Data
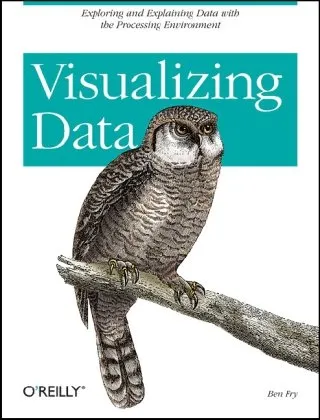
Visualizing Data by Ben Fry is a groundbreaking guide to the art and science of data visualization. The book offers a comprehensive and methodical approach to turning large, complex datasets into clear, captivating visuals. Written by a pioneer in computational design, this book emphasizes not only the technical skills needed to create effective visualizations but also the design practices that make them impactful and meaningful.
Data visualization has become an indispensable tool for understanding and communicating complex ideas in the modern world. Whether you're working with statistical information, scientific data, or financial trends, the ability to transform raw data into readable and engaging visual outputs is a skill of growing importance. This book is specifically tailored to help individuals of all backgrounds—be it developers, designers, analysts, or educators—build this skill step-by-step.
With a focus on combining technical mastery with creative thinking, Visualizing Data equips readers with the tools they need to illuminate insights and tell compelling data stories. As you dive into its insights, you'll discover why this book remains one of the most respected resources on effective visualization methods.
Detailed Summary of the Book
Visualizing Data follows a structured framework that walks readers through the entire process of generating data visualizations, starting from scratch. It introduces the concept of a seven-step framework, which acts as the foundation for understanding, processing, and representing data. These steps are:
- Acquire: Obtain the dataset you want to analyze.
- Parse: Organize and format the data so that it can be analyzed.
- Filter: Clean and refine the dataset to focus on relevant information.
- Mine: Extract meaningful patterns and derive insights.
- Represent: Choose the right visual model or metaphor to communicate the data.
- Refine: Polish the visualization to improve clarity, aesthetics, and usability.
- Interact: Add user interaction or customization when applicable.
The book is primarily written with the Processing programming language, a tool crafted specifically with visual and computational design in mind. Key concepts like scaling, mapping, and layout are explained in detail using examples from practical projects. Readers will learn to develop both static and interactive visual representations of data, with particular emphasis on understanding the stories hidden within datasets. It's not just about converting data into charts—it's about transforming data into meaningful communication.
Key Takeaways
Here are some of the most important lessons you'll learn from Visualizing Data:
- How to approach data visualization as both a science and an art form.
- The significance of storytelling in creating effective visualizations.
- Principles of design that enhance understanding and user engagement.
- Step-by-step instructions for creating visualizations using the Processing language.
- The importance of refining and tailoring visualizations to their audience and context.
- A systematic, repeatable process for tackling datasets of any complexity or size.
- How to think critically about data representation choices to avoid misleading narratives.
By the end of this book, you will not only understand how to create visualizations but also why certain methods are more effective than others. You will develop a keen eye for evaluating existing visual designs and generating your own with confidence.
Famous Quotes from the Book
Visualizing Data is packed with insightful observations on the creative and technical process of data representation. Some of the most memorable quotes include:
"Data is a powerful narrative tool. It can tell stories that words cannot."
"The goal of visualization is not to simplify, but to clarify."
"Effective representations reveal the most important parts of the data while deliberately hiding the rest."
These quotes reflect the book's emphasis on balance—using data visualization to unravel complexity while maintaining precision and integrity.
Why This Book Matters
Visualizing Data holds a unique place in the fields of data science and design. It bridges two critical domains—technical programming skills and creative visual storytelling. In an age where data drives decisions at every level, this book provides the blueprint to make complex information accessible to diverse audiences.
What sets Visualizing Data apart is its holistic approach. Instead of focusing solely on tools or software, it prioritizes the thought process and strategy behind visualization. This makes it valuable not just for beginners, but also for seasoned professionals seeking to refine their craft.
For anyone striving to make data more meaningful, engaging, and visually compelling, this book is an essential resource. It's a powerful reminder that data, when thoughtfully visualized, has the potential to transform ideas, spark action, and change perspectives.
Free Direct Download
You Can Download this book after Login
Accessing books through legal platforms and public libraries not only supports the rights of authors and publishers but also contributes to the sustainability of reading culture. Before downloading, please take a moment to consider these options.
Find this book on other platforms:
WorldCat helps you find books in libraries worldwide.
See ratings, reviews, and discussions on Goodreads.
Find and buy rare or used books on AbeBooks.
