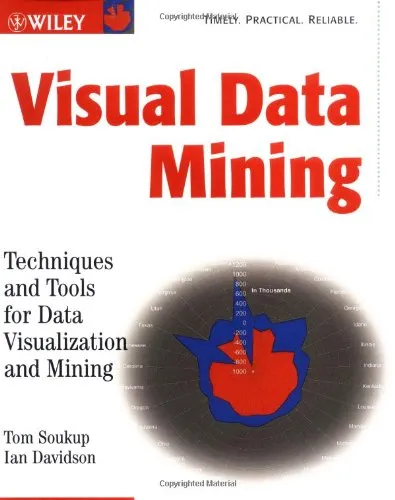
Visual Data Mining: Techniques and Tools for Data Visualization and Mining
4.0
Reviews from our users

You Can Ask your questions from this book's AI after Login
Each download or ask from book AI costs 2 points. To earn more free points, please visit the Points Guide Page and complete some valuable actions.Related Refrences:
Introduction to "Visual Data Mining: Techniques and Tools for Data Visualization and Mining"
Welcome to "Visual Data Mining: Techniques and Tools for Data Visualization and Mining," a comprehensive guide that delves into the powerful confluence of visual analytics and data mining. Written for data scientists, analysts, researchers, and professionals, this book bridges the gap between two transformative fields—data visualization and data mining—and showcases how their synergy can reveal profound insights within complex datasets.
In today's data-driven world, the ability to uncover patterns, trends, and relationships from vast amounts of information is a critical skill. Through this book, we aim to empower readers with innovative techniques, cutting-edge tools, and practical methodologies to interpret data visually and make meaningful decisions. Whether you're an academic researcher trying to identify new trends, a business leader looking to optimize operations, or a curious learner eager to explore visual data techniques, this book will serve as a vital resource in your journey.
Detailed Summary
"Visual Data Mining: Techniques and Tools for Data Visualization and Mining" provides a systematic overview of the fusion between visualization and data mining. The book explores techniques that enable users to visually interpret and explore large datasets while making complex concepts accessible to readers through clear examples and explanations.
It begins with an introduction to the fundamental principles of data mining—identifying patterns, discovering correlations, and predicting outcomes—before transitioning to the principles and theories of data visualization. The unique aspect of this book is the emphasis placed on visualizing insights from the data mining process. By leveraging visualization, professionals can grasp the meaning of multidimensional datasets faster and with greater accuracy.
Key topics discussed include various visualization techniques, such as scatterplots, heatmaps, and multidimensional projections, as well as advanced data mining methods, including clustering, classification, and rule induction. The book also introduces software tools and technologies, demonstrating their practical application in real-world scenarios.
Throughout its chapters, the book strikes a balance between theoretical depth and hands-on applications, ensuring it caters both to seasoned experts and beginners venturing into the field. By combining visuals and statistical models, readers can gain a holistic understanding of their data to support strategic decision-making.
Key Takeaways
- Discover the core principles of data mining and visualization and understand their interconnectedness.
- Learn about essential techniques like clustering, classification, linear projection, and their visual representations.
- Explore real-world use cases of visual data mining and how businesses, governments, and researchers apply these methodologies effectively.
- Get hands-on insights into leading visualization tools and frameworks for analyzing big data.
- Understand how visuals enhance interpretability and decision-making in multidisciplinary contexts.
Famous Quotes from the Book
-
"Data, in its raw form, can be overwhelming. But when visualized, it transforms chaos into clarity, sparking insights that lead to action."
-
"The intersection of data mining and visualization is where science meets art—a place where patterns and meanings unfold effortlessly."
-
"Every dataset tells a story, and it is through effective visualization that we give voice to that story."
Why This Book Matters
In today's fast-paced world, data has become the new currency, and the ability to extract value from it is paramount. However, with the exponential growth of data in size and complexity, analytical tools alone are insufficient. Organizations and individuals need innovative ways to make sense of information faster and more effectively; this is where visual data mining plays a pivotal role.
This book addresses the growing demand for comprehensive resources that bring together data visualization and mining. It empowers readers not just to analyze numbers but to see the patterns, relationships, and anomalies hidden within them. By providing both theoretical foundations and practical applications, this book builds a unique bridge between the science of data analytics and the art of visualization.
Moreover, the book emphasizes democratizing data understanding. By turning complex outputs into intuitive graphs, charts, and diagrams, it ensures that data-driven insights can be interpreted and acted upon by audiences beyond data scientists, including policymakers, educators, and business leaders.
Free Direct Download
You Can Download this book after Login
Accessing books through legal platforms and public libraries not only supports the rights of authors and publishers but also contributes to the sustainability of reading culture. Before downloading, please take a moment to consider these options.
Find this book on other platforms:
WorldCat helps you find books in libraries worldwide.
See ratings, reviews, and discussions on Goodreads.
Find and buy rare or used books on AbeBooks.
1367
بازدید4.0
امتیاز0
نظر98%
رضایتReviews:
4.0
Based on 0 users review
Questions & Answers
Ask questions about this book or help others by answering
No questions yet. Be the first to ask!
