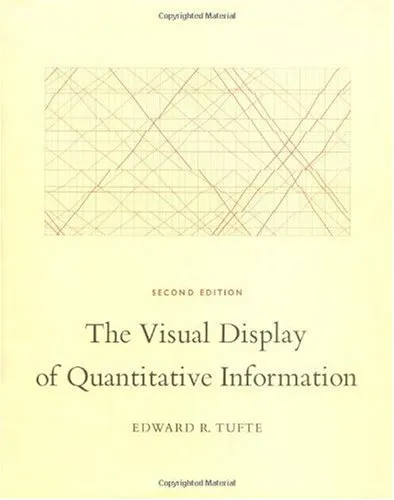
The Visual Display of Quantitative Information
4.5
Reviews from our users

You Can Ask your questions from this book's AI after Login
Each download or ask from book AI costs 2 points. To earn more free points, please visit the Points Guide Page and complete some valuable actions.Related Refrences:
The Visual Display of Quantitative Information
Edward R. Tufte's seminal work, 'The Visual Display of Quantitative Information', stands as a pivotal contribution to the fields of data visualization and information design. Known for its authoritative voice and meticulous approach, this book offers a comprehensive exploration of the art and science of presenting quantitative data clearly and effectively.
Detailed Summary of the Book
This book explores the principles and practices of data visualization, guided by the foundational aspects of graphical integrity and excellence. Tufte argues that visual displays should communicate complex information with clarity and precision. Starting with a historical context, the book traces the development of data visualization from the 18th century to contemporary practices, showcasing examples of both exemplary and flawed visualizations.
It delves into the intricacies of constructing high-quality graphics, emphasizing the importance of accuracy, simplicity, and efficiency. Tufte stresses that graphics should not only be aesthetically pleasing but also serve as efficient tools for reasoning about quantitative data. The narrative is punctuated by numerous examples and case studies, demonstrating how effective design can transform raw data into persuasive and convincing visual evidence.
Key Takeaways
- Graphical Excellence: Tufte outlines that the goal of graphic excellence is to present complex ideas with clarity, precision, and efficiency.
- Data-Ink Ratio: He introduces the principle of maximizing the data-ink ratio, focusing on the non-erasable core of the graphic that represents the data itself.
- Simplicity and Clarity: The book reinforces the idea that simplicity is not synonymous with being simplistic. Rather, it is about stripping away non-essential elements to highlight key data insights.
- Integrity in Graphics: Visual representations should not distort the underlying data. Tufte champions honesty and integrity in the depiction of quantitative information.
Famous Quotes from the Book
"Graphical excellence is the well-designed presentation of interesting data – a matter of substance, of statistics, and of design."
"Above all else show the data."
"Avoid distorting what the data have to say."
Why This Book Matters
The significance of 'The Visual Display of Quantitative Information' lies in its visionary foresight and timeless wisdom. Tufte's work laid the foundation for modern data visualization practices, influencing generations of designers, analysts, and scholars. It serves as an essential guide for anyone involved in the presentation of data, urging practitioners to adhere to the principles of honesty, clarity, and efficiency.
The book holds particular relevance today, amidst the explosion of data and the proliferation of visual content. With the increasing complexity of information, Tufte’s teachings provide invaluable guidance on how to navigate the challenges of presenting data in a way that is both accurate and engaging.
In short, Tufte's work champions the transformative power of effective data visualization, positing that well-crafted visuals not only elucidate data but also inspire better decision-making and deeper understanding.
Free Direct Download
You Can Download this book after Login
Accessing books through legal platforms and public libraries not only supports the rights of authors and publishers but also contributes to the sustainability of reading culture. Before downloading, please take a moment to consider these options.
Find this book on other platforms:
WorldCat helps you find books in libraries worldwide.
See ratings, reviews, and discussions on Goodreads.
Find and buy rare or used books on AbeBooks.
1414
بازدید4.5
امتیاز0
نظر98%
رضایتReviews:
4.5
Based on 0 users review
Questions & Answers
Ask questions about this book or help others by answering
No questions yet. Be the first to ask!
