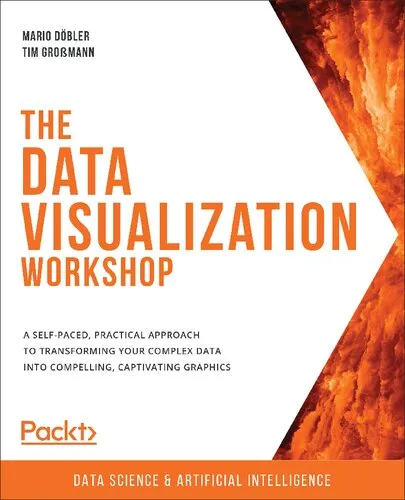
The Data Visualization Workshop: A self-paced, practical approach to transforming your complex data into compelling, captivating graphics

5.0

Reviews from our users

You Can Ask your questions from this book's AI after Login
Each download or ask from book AI costs 2 points. To earn more free points, please visit the Points Guide Page and complete some valuable actions.

Explore a modern approach to visualizing data with Python and transform large real-world datasets into expressive visual graphics using this beginner-friendly workshopKey FeaturesDiscover the essential tools and methods of data visualizationLearn to use standard Python plotting libraries such as Matplotlib and SeabornGain insights into the visualization techniques of big companiesBook DescriptionDo you want to transform data into captivating images? Do you want to make it easy for your audience to process and understand the patterns, trends, and relationships hidden within your data?The Data Visualization Workshop will guide you through the world of data visualization and help you to unlock simple secrets for transforming data into meaningful visuals with the help of exciting exercises and activities.Starting with an introduction to data visualization, this book shows you how to first prepare raw data for visualization using NumPy and pandas operations. As you progress, you'll use plotting techniques, such as comparison and distribution, to identify relationships and similarities between datasets. You'll then work through practical exercises to simplify the process of creating visualizations using Python plotting libraries such as Matplotlib and Seaborn. If you've ever wondered how popular companies like Uber and Airbnb use geoplotlib for geographical visualizations, this book has got you covered, helping you analyze and understand the process effectively. Finally, you'll use the Bokeh library to create dynamic visualizations that can be integrated into any web page.By the end of this workshop, you'll have learned how to present engaging mission-critical insights by creating impactful visualizations with real-world data.What you will learnUnderstand the importance of data visualization in data scienceImplement NumPy and pandas operations on real-life datasetsCreate captivating data visualizations using plotting librariesUse advanced techniques to plot geospatial data on a mapIntegrate interactive visualizations to a webpageVisualize stock prices with Bokeh and analyze Airbnb data with MatplotlibWho this book is forThe Data Visualization Workshop is for beginners who want to learn data visualization, as well as developers and data scientists who are looking to enrich their practical data science skills. Prior knowledge of data analytics, data science, and visualization is not mandatory. Knowledge of Python basics and high-school-level math will help you grasp the concepts covered in this data visualization book more quickly and effectively.Table of ContentsThe Importance of Data Visualization and Data ExplorationAll You Need to Know about PlotsA Deep Dive into MatplotlibSimplifying Visualizations Using SeabornPlotting Geospatial DataMaking Things Interactive with BokehCombining What We Have Learned

Free Direct Download

You Can Download this book after Login

Accessing books through legal platforms and public libraries not only supports the rights of authors and publishers but also contributes to the sustainability of reading culture. Before downloading, please take a moment to consider these options.

Find this book on other platforms:

WorldCat helps you find books in libraries worldwide.
See ratings, reviews, and discussions on Goodreads.
Find and buy rare or used books on AbeBooks.

1271

بازدید

5.0

امتیاز

52

نظر

98%

رضایت

Reviews:


5.0

Based on 2 users review

احمد محمدی

"کیفیت چاپ عالی بود، خیلی راضی‌ام"

⭐⭐⭐⭐⭐
the_melting
the_melting

June 29, 2025, 3:38 p.m.

I am a Data Scientist, and as much as modeling is important, data visualization is very crucial too. It is very important to communicate a story through the data. I have been working with various open source visualization tools, and mostly find myself looking at the documentation to understand the use. After giving a read to "The Data Visualization Workshop by Mario and Tim, I have got a sense of instantaneously knowing which plot with be the best to choose for a particular type of data. This book is an excellent resource to have if you are a Data Scientist and want to leverage the power of data visualization at work.


the_melting
the_melting

June 29, 2025, 3:41 p.m.

I am a Data Scientist, and as much as modeling is important, data visualization is very crucial too. It is very important to communicate a story through the data. I have been working with various open source visualization tools, and mostly find myself looking at the documentation to understand the use. After giving a read to "The Data Visualization Workshop by Mario and Tim, I have got a sense of instantaneously knowing which plot with be the best to choose for a particular type of data. This book is an excellent resource to have if you are a Data Scientist and want to leverage the power of data visualization at work.


Questions & Answers

Ask questions about this book or help others by answering


Please login to ask a question

No questions yet. Be the first to ask!