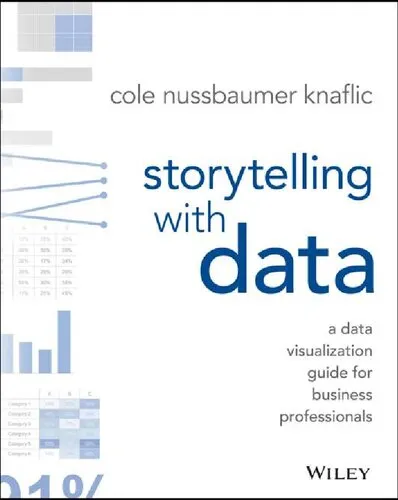
Storytelling with data a data visualization guide for business professionals Knaflic, Cole Nussbaumer
4.7
Reviews from our users

You Can Ask your questions from this book's AI after Login
Each download or ask from book AI costs 2 points. To earn more free points, please visit the Points Guide Page and complete some valuable actions.Related Refrences:
Introduction to 'Storytelling with Data'
In today's data-driven world, the ability to interpret and effectively communicate data insights is a crucial skill for business professionals. "Storytelling with Data: A Data Visualization Guide for Business Professionals" by Cole Nussbaumer Knaflic serves as a comprehensive resource for anyone aiming to transform complex data into engaging and informative visual narratives. This guide breaks down the barriers of confusing charts and graphs, making data accessible and meaningful to audiences of all backgrounds.
Detailed Summary of the Book
Cole Nussbaumer Knaflic’s "Storytelling with Data" provides readers with practical advice on how to turn data into compelling stories. This book begins by setting the foundation for effective data visualization, expounding on the importance of context and audience understanding. Knaflic emphasizes that data should not merely be presented as is but rather curated carefully to emphasize significant insights.
The book further delves into the different types of charts and graphs, their suitable applications, and common visualization pitfalls to avoid. Knaflic uses real-world examples to illustrate both poor and effective data visualization practices. A heuristic approach to selecting the right visual elements, coupled with strategic use of color, size, and layout, forms a seminal part of the narrative.
Knaflic’s book stands out through its emphasis on storytelling elements — components like narrative flow, structure, and audience engagement are masterfully tied into data presentation. By the conclusion of the book, readers will have a toolkit of techniques designed to convey data in an emotionally resonant and intellectually clear manner, ushering the audience from data confusion towards insight clarity.
Key Takeaways
One of the main takeaways from "Storytelling with Data" is the paramount importance of audience understanding. Knaflic consistently advocates for tailoring your data narrative to the needs and understanding of your audience. Additionally, the book highlights the necessity of context in data presentation, suggesting that data without context is often misleading or irrelevant.
Another crucial lesson is the power of simplification. Knaflic supports the idea that the best visuals are those that strip away unnecessary complexity, focusing instead on clear and concise depictions of data. Readers will learn valuable lessons about reducing clutter and honing in on the narrative power of simplicity.
The book also provides actionable techniques on capturing attention through effective visual storytelling, leveraging design principles to craft data stories that not only inform but inspire action from audiences.
Famous Quotes from the Book
Here are some memorable quotes from "Storytelling with Data" that encapsulate its core teachings:
- "Accessible data can become a story, communicated through the art of visual storytelling."
- "Effective storytelling is about making data come to life for your audience."
- "Data visualization is not about pretty pictures, but about what the visuals communicate."
Why This Book Matters
"Storytelling with Data" is vital for professionals across industries because it bridges the gap between data analysis and audience understanding. As the volume of data professionals encounter on a daily basis increases, so does the need to translate this information effectively to diverse stakeholders. Knaflic’s guide transcends traditional data visualization books by placing equal emphasis on data storytelling, enabling readers to craft narratives that not only educate but also persuade and motivate.
The practical insights and real-world examples offered in the book make it a trusted companion for those looking to improve their data communication skills, ensuring their audience can make well-informed decisions derived from their data presentations. This book is a quintessential resource for encouraging a culture of data literacy and effective communication within organizations.
Free Direct Download
You Can Download this book after Login
Accessing books through legal platforms and public libraries not only supports the rights of authors and publishers but also contributes to the sustainability of reading culture. Before downloading, please take a moment to consider these options.
Find this book on other platforms:
WorldCat helps you find books in libraries worldwide.
See ratings, reviews, and discussions on Goodreads.
Find and buy rare or used books on AbeBooks.
Questions about Book
1532
بازدید4.7
امتیاز0
نظر98%
رضایتReviews:
4.7
Based on 0 users review
Questions & Answers
Ask questions about this book or help others by answering
No questions yet. Be the first to ask!
