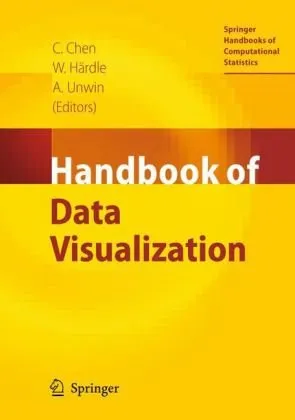
Handbook of Data Visualization (Springer Handbooks of Computational Statistics)
4.5
Reviews from our users

You Can Ask your questions from this book's AI after Login
Each download or ask from book AI costs 2 points. To earn more free points, please visit the Points Guide Page and complete some valuable actions.Related Refrences:
Introduction to "Handbook of Data Visualization"
The Handbook of Data Visualization is a comprehensive volume that delves into the art and science of visually representing data. As part of the acclaimed Springer Handbooks of Computational Statistics series, this book serves as an essential guide for statisticians, data scientists, and researchers across disciplines who aim to leverage visualization techniques to uncover patterns, communicate insights, and make data accessible. Co-edited by Chun-houh Chen, Wolfgang Härdle, and Antony Unwin, the book makes a compelling case for the central role that visualization plays in modern data analysis.
In an era marked by exponential growth in data generation, the ability to transform vast datasets into intuitive visuals is more important than ever. From statistical graphics to sophisticated multivariate visualizations, this handbook offers readers theoretical grounding coupled with practical applications, bringing together contributions from leading experts in the field. Packed with detailed descriptions, real-world case studies, and advanced methodologies, the book strikes a balance between accessibility and rigor, making it an indispensable resource for learners and practitioners alike.
Detailed Summary of the Book
The Handbook of Data Visualization is an expansive guide structured to address the fundamentals, innovations, and applications of data visualization. The book begins with a foundational overview of visualization concepts, introducing readers to key principles such as perceptual psychology, user interactivity, and interpretation challenges. As the chapters unfold, various visualization paradigms are explored in depth—including static and interactive visualizations, hierarchical and network visualizations, spatiotemporal representations, and software tools designed for visualization tasks.
Beyond the technical, the book emphasizes the interpretive aspect of data visualization. It integrates aspects of storytelling, design aesthetics, and decision-making, showcasing techniques that not only display data but make it comprehensible and actionable. A significant portion of the book is dedicated to case studies across domains such as finance, healthcare, and social science, highlighting how visualization bridges the gap between raw numbers and actionable insights.
What sets this book apart is its rigorous exploration of multivariate data visualization—a complex area that addresses data with multiple dimensions. Techniques like parallel coordinates, scatterplot matrices, and trellis plots are extensively discussed, providing readers with pragmatic approaches to handle high-dimensional datasets.
Key Takeaways
-
1. Interdisciplinary Perspective
Data visualization is presented as an intersection of statistics, computer science, and psychology, ensuring that readers understand its multifaceted nature.
-
2. Practical Applications
Readers gain exposure to practical tools and techniques tailored for real-world datasets across numerous domains.
-
3. Advanced Visualization Techniques
From interactive dashboards to dynamic visualizations, the book covers advanced concepts that are critical in modern analytics.
-
4. User-Centric Design
Focuses on designing visuals that are not only technically accurate but also user-friendly and engaging.
Famous Quotes from the Book
“Visualization is not just about making data look pretty—it’s about transforming information into understanding.”
“The best visualizations are those that reveal the unexpected and make patterns apparent.”
“Every dataset tells a story, and visualization is the key to unlocking it.”
Why This Book Matters
The significance of the Handbook of Data Visualization lies in its ability to bridge the gap between raw data and informed decision-making. As organizations increasingly recognize the importance of data-driven strategies, visuals have emerged as quintessential tools for communication and interpretation. However, effective visualization requires a nuanced understanding of both the underlying data and the audiences’ cognitive processes.
This book empowers readers to go beyond basic charts and graphs, equipping them with the skills to create compelling visuals that highlight trends, relationships, and outliers without sacrificing precision. The emphasis on multivariate data visualization, in particular, addresses a critical need for professionals handling complex datasets across fields like finance, medicine, and sociology.
By blending theory with practical application, this handbook not only serves as a technical reference but also fosters a deeper appreciation for the role of visualization in analytics. It is a must-read for anyone serious about mastering the art and science of data visualization in today’s data-centric world.
Free Direct Download
You Can Download this book after Login
Accessing books through legal platforms and public libraries not only supports the rights of authors and publishers but also contributes to the sustainability of reading culture. Before downloading, please take a moment to consider these options.
Find this book on other platforms:
WorldCat helps you find books in libraries worldwide.
See ratings, reviews, and discussions on Goodreads.
Find and buy rare or used books on AbeBooks.
1275
بازدید4.5
امتیاز0
نظر98%
رضایتReviews:
4.5
Based on 0 users review
Questions & Answers
Ask questions about this book or help others by answering
No questions yet. Be the first to ask!
