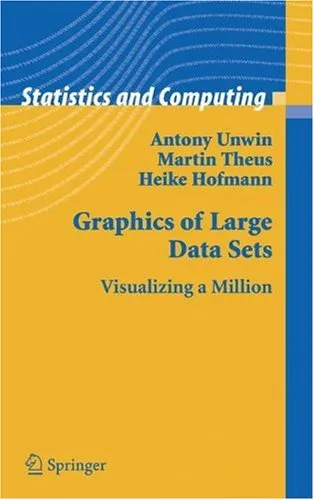
Graphics of Large Data Sets: Visualizing a Million
4.5
Reviews from our users

You Can Ask your questions from this book's AI after Login
Each download or ask from book AI costs 2 points. To earn more free points, please visit the Points Guide Page and complete some valuable actions.Related Refrences:
Introduction
In today's data-driven world, we are surrounded by increasingly vast amounts of information, often measured in terabytes or even petabytes. While advanced computational infrastructures and algorithms have been developed to process large-scale data, making sense of such volumes still presents unique challenges. This is where the power of visualization comes into focus: condensing millions of data points into meaningful, interpretable, and actionable insights. "Graphics of Large Data Sets: Visualizing a Million" is a comprehensive exploration of how visualization tools and techniques can tackle the challenges posed by exceptionally large datasets. Written by Antony Unwin, a pioneering figure in data visualization, this book does not just present technical solutions but also emphasizes the art and science of communicating complex patterns effectively.
Whether you are an academic, data scientist, statistician, or visualization enthusiast, this book serves as an indispensable resource for anyone interested in mastering the art of visualizing "big data." With a focus on approaching large datasets innovatively and practically, it combines theoretical concepts, real-world applications, and inspiring examples to guide readers through the process of data visualization.
Detailed Summary of the Book
"Graphics of Large Data Sets: Visualizing a Million" delves into the challenges and possibilities of creating visual representations for massive datasets. Unlike traditional statistical tasks, working with millions of data points requires innovative approaches to ensure both clarity and relevance. The book begins with foundational principles of statistical graphics, discussing what makes a visualization effective, informative, and engaging.
As the chapters progress, the book introduces strategies for dealing with overwhelming volumes of data, such as data reduction techniques, sampling methods, and aggregation strategies. It highlights the importance of understanding the audience's needs and tailoring visualizations accordingly. Furthermore, it explores specific visualization types—such as scatterplots, heatmaps, treemaps, and parallel coordinates—showing their strengths and limitations when working with extensive datasets.
Through rich examples and case studies, the book provides practical insights into how to approach common big data problems in fields ranging from business intelligence to genetics data analysis. From dealing with overplotting to constructing visually appealing summaries, the text offers thoroughly tested methods for making sense of complex data. The use of R, one of the most popular programming languages for data visualization, is also covered in multiple contexts, though the approaches are language-agnostic and broadly applicable.
Key Takeaways
- Understanding the principles of effective data visualization and design.
- Techniques for managing overplotting and high data densities in graphics.
- Practical strategies for reducing data scales without losing critical information.
- Insights and tools for working with millions of data points in domains from social sciences to machine learning.
- Best practices for integrating statistical thinking into visualization workflows.
- Case studies that illustrate the real-world application of visualization techniques on large datasets.
Famous Quotes from the Book
"Big data doesn’t just demand processing power; it demands visual clarity to uncover its narratives."
"A great visualization not only reveals what is there but also challenges us to see what we may have overlooked."
"Simplifying millions of observations into one image is a craft—an art grounded in mathematics, creativity, and intuition."
Why This Book Matters
"Graphics of Large Data Sets: Visualizing a Million" occupies a unique position in the fields of data science and visual analytics, addressing the often-overlooked nuances of working with truly massive datasets. While many books focus on generic visualization principles, few provide the depth of understanding needed to deal with the specific challenges of high-volume data. This book matters because it combines technical rigor with creative problem-solving, offering solutions that go beyond superficial design choices.
As we continue to generate data on an unprecedented scale, the ability to visualize such information becomes increasingly critical in fields ranging from climate science to finance. The insights presented in this book empower readers to transform raw, complex data into structured, meaningful graphics that drive better decision-making, research, and communication.
By emphasizing the interplay of artistry and statistical rigor, Antony Unwin introduces readers to a new way of thinking about data visualization. This is not just a book to read but a practical guide to implementing techniques that will change how you approach your datasets forever.
Free Direct Download
You Can Download this book after Login
Accessing books through legal platforms and public libraries not only supports the rights of authors and publishers but also contributes to the sustainability of reading culture. Before downloading, please take a moment to consider these options.
Find this book on other platforms:
WorldCat helps you find books in libraries worldwide.
See ratings, reviews, and discussions on Goodreads.
Find and buy rare or used books on AbeBooks.
1320
بازدید4.5
امتیاز0
نظر98%
رضایتReviews:
4.5
Based on 0 users review
Questions & Answers
Ask questions about this book or help others by answering
No questions yet. Be the first to ask!
