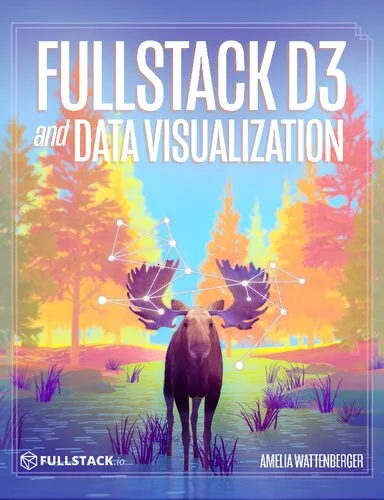
Fullstack Data Visualization with D3 Build Beautiful Data Visualizations and Dashboards with D3
4.6
Reviews from our users

You Can Ask your questions from this book's AI after Login
Each download or ask from book AI costs 2 points. To earn more free points, please visit the Points Guide Page and complete some valuable actions.Related Refrences:
Introduction
Welcome to "Fullstack Data Visualization with D3: Build Beautiful Data Visualizations and Dashboards with D3," your comprehensive guide to mastering the art and science of data visualization using the D3.js library. Whether you're a data scientist, web developer, or simply someone fascinated by the power of turning numbers into stories, this book provides the expertise and insights to elevate your skills in crafting visually stunning and insightful data visualizations.
Detailed Summary of the Book
This book is a deep dive into the world of data visualization with a focus on practical applications using D3.js, a powerful JavaScript library that allows developers to create highly customizable visual data representations on the web. Throughout the book, you will be guided through the process of understanding data, choosing the right type of visualization, and implementing it in a way that best conveys the underlying insights.
The journey begins with an introduction to the fundamental concepts of data visualization, setting the stage for why visualization matters in today's data-driven world. As you proceed, you'll encounter in-depth chapters dedicated to the mechanics of D3.js, covering everything from basic selections and data binding to more complex topics like scales, axes, and visual transitions.
Each chapter builds on the last, introducing new concepts and techniques that progressively enhance your ability to manage and visualize data. You'll explore methods for creating various types of graphs, such as bar charts, scatter plots, and line graphs, all while utilizing the full capabilities of D3 to create interactive and dynamic visualizations. By the end of the book, you will not only have mastered the technical skills required to use D3.js but also acquired a deep understanding of how to tell compelling stories through data.
Key Takeaways
- Understand the principles of data visualization and its impact on modern communication.
- Gain hands-on experience with D3.js, from basic to advanced techniques.
- Learn to create various types of data visualizations, including basic charts and complex interactive dashboards.
- Master the art of storytelling through data by integrating narrative with visual elements.
- Enhance your web applications with engaging data-driven visual components.
Famous Quotes from the Book
"Data visualization is not just about creating beautiful charts—it's about making data meaningful and accessible."
"D3.js is not just a tool; it's a canvas for your data creativity."
Why This Book Matters
In a world where data is ubiquitous yet often overwhelming, "Fullstack Data Visualization with D3" stands out as an essential resource for anyone looking to harness the power of data through visual means. This book matters because it bridges the gap between raw data and perception, providing a framework for transforming complex datasets into crisp, clear visual stories that can influence decision-making, drive innovation, and inspire change.
Data Visualization is integral in industries ranging from business intelligence to healthcare, finance, and beyond. With this book, you're not just learning about creating charts; you are acquiring a skillset essential for the digital age where visual data understanding becomes a key competitive advantage.
Free Direct Download
You Can Download this book after Login
Accessing books through legal platforms and public libraries not only supports the rights of authors and publishers but also contributes to the sustainability of reading culture. Before downloading, please take a moment to consider these options.
Find this book on other platforms:
WorldCat helps you find books in libraries worldwide.
See ratings, reviews, and discussions on Goodreads.
Find and buy rare or used books on AbeBooks.
1348
بازدید4.6
امتیاز0
نظر98%
رضایتReviews:
4.6
Based on 0 users review
Questions & Answers
Ask questions about this book or help others by answering
No questions yet. Be the first to ask!
