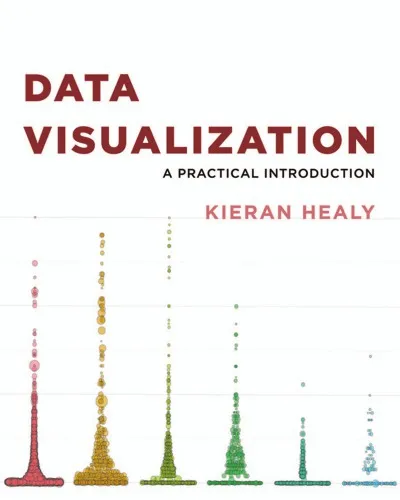
Data Visualization: A Practical Introduction
4.5
Reviews from our users

You Can Ask your questions from this book's AI after Login
Each download or ask from book AI costs 2 points. To earn more free points, please visit the Points Guide Page and complete some valuable actions.Related Refrences:
Introduction
"Data Visualization: A Practical Introduction" is a comprehensive guide that delves into the art and science of presenting data in a clear, concise, and visually appealing manner. Written by Kieran Healy, an expert in data presentation, this book is an invaluable resource for anyone who wants to learn the fundamentals of data visualization using the R programming language. The book is structured to cater to both beginners and those with some experience in the field, making it an essential tool for data analysts, researchers, and anyone interested in turning raw data into compelling stories.
Detailed Summary of the Book
The book begins by explaining the importance of data visualization, highlighting its role in making complex data accessible and understandable. Healy emphasizes the importance of thinking about one's audience and the message one wants to convey with data. The book uses the R library ggplot2, which is praised for its versatility and power in creating various types of plots and charts. Each chapter builds on the previous one, introducing new concepts and techniques in a logical and structured manner.
Kieran Healy covers the basics of R and ggplot2 in the initial chapters, providing readers with a foundation in setting up their environment and understanding the grammar of graphics. The book then progresses to more advanced topics, such as manipulating data, understanding scales, creating polished plots, and customizing visualization elements to suit specific needs.
Through practical examples and real-world datasets, Healy ensures that readers get hands-on experience in applying what they've learned. He also offers insight into the best practices of data visualization, guiding readers on how to avoid common pitfalls and to approach visualization with a critical eye.
Key Takeaways
- Understand the fundamental principles of effective data visualization.
- Learn to use the R programming language and ggplot2 library for creating clear and engaging visualizations.
- Gain practical experience through hands-on examples and exercises.
- Develop the ability to critically analyze and improve your visualizations.
Famous Quotes from the Book
"Good data visualization helps you understand your data and yourself, better."
"The best visualizations are not just for showing what's clear, but for making clear what is hard to see."
Why This Book Matters
Data visualization is an essential skill in today's data-driven world. Whether you're a business professional, academic, or researcher, the ability to convey complex information visually can significantly impact your work. "Data Visualization: A Practical Introduction" is not just a textbook; it is a toolkit for anyone looking to enhance their understanding and communication of data.
Healy's clear and engaging writing style, combined with his practical approach, makes this book a must-read for those looking to deepen their knowledge of data visualization. The use of real-world examples and exercises allows readers to apply what they have learned in concrete ways, bridging the gap between theory and practice.
Moreover, Kieran Healy's insights into the common challenges of data visualization and his emphasis on clarity and truthfulness in data presentation make this book highly relevant for anyone concerned with the ethical dimensions of data representation. By mastering the strategies outlined in this book, readers are better equipped to create thoughtful and effective visualizations in any professional field.
Free Direct Download
You Can Download this book after Login
Accessing books through legal platforms and public libraries not only supports the rights of authors and publishers but also contributes to the sustainability of reading culture. Before downloading, please take a moment to consider these options.
Find this book on other platforms:
WorldCat helps you find books in libraries worldwide.
See ratings, reviews, and discussions on Goodreads.
Find and buy rare or used books on AbeBooks.
1475
بازدید4.5
امتیاز0
نظر98%
رضایتReviews:
4.5
Based on 0 users review
Questions & Answers
Ask questions about this book or help others by answering
No questions yet. Be the first to ask!
