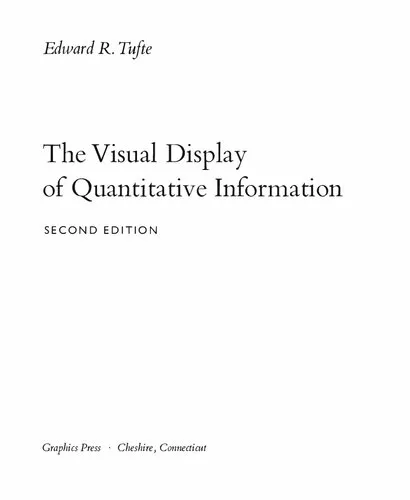
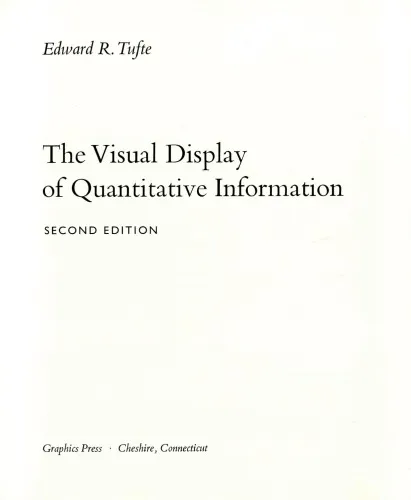
(with selectable text) The Visual Display of Quantitative Information
4.6
بر اساس نظر کاربران

شما میتونید سوالاتتون در باره کتاب رو از هوش مصنوعیش بعد از ورود بپرسید
هر دانلود یا پرسش از هوش مصنوعی 2 امتیاز لازم دارد، برای بدست آوردن امتیاز رایگان، به صفحه ی راهنمای امتیازات سر بزنید و یک سری کار ارزشمند انجام بدینکتاب های مرتبط:
معرفی کتاب '(with selectable text) The Visual Display of Quantitative Information'
کتاب The Visual Display of Quantitative Information یکی از برجستهترین و تأثیرگذارترین کتابها در زمینه نمایش گرافیکی و بصری دادههای کمی است که توسط ادوارد تیفته تألیف شده است. این اثر که به عنوان راهنمایی جامع برای طراحان و تحلیلگران داده شناخته میشود، روشهای صحیح و اصولی برای نمایش دادههای عددی را ارائه میدهد. کتاب به بررسی ساختارهای بصری که منجر به افزایش فهم و درک بهتر اطلاعات میشود میپردازد.
خلاصه کتاب
کتاب در دو بخش اصلی تقسیم شده است. بخش اول با عنوان «اصول اساسی» به توضیح مبانی و اصول طراحی بصری دادهها میپردازد. تیفته در این بخش تأکید میکند که نمودارها و گرافها باید ساده، دقیق و قابل فهم باشند. استفاده صحیح از مقیاسها، برچسبگذاریهای مناسب و انتخاب رنگهای درست از جمله نکاتی است که در این بخش تشریح میشود.
بخش دوم کتاب به بررسی «کاربردها و نمونهها» اختصاص دارد که در آن نویسنده مثالهای واقعی از نمایشهای گرافیکی موفق و همچنین اشتباهاتی که معمولاً در این زمینه رخ میدهد را ارائه میکند. تیفته نشان میدهد چگونه برخی از پیچیدهترین اطلاعات را میتوان به شکلی بصری و قابل فهم ارائه کرد.
نکات کلیدی
- اهمیت سادگی و شفافیت در طراحی نمایشهای گرافیکی.
- رعایت مقیاس صحیح و برچسبگذاری واضح.
- اجتناب از اطلاعات زائد و پیچیدگیهای غیرضروری.
- چگونگی استفاده موثر از رنگ و فرم در نمایش دادهها.
نقلقولهای معروف از کتاب
سادهسازی، کلید فهمیدن است.
نمودار نباید چیزی برای پنهان کردن داشته باشد.
چرا این کتاب مهم است
این کتاب به دلیل تأثیرات گستردهای که در نحوه ارائه دادهها در رشتههای مختلف مثل آمار، اقتصاد، پزشکی و بسیاری دیگر از حوزهها داشته، اهمیت بسزایی دارد. با ارائه اصول واضح و استراتژیهایی برای بهبود نمایش گرافیکی اطلاعات، The Visual Display of Quantitative Information به یکی از مراجع اساسی و اصولی در این زمینه تبدیل شده است. طراحی کارآمد دادهها نقش مهمی در تصمیمگیریهای اساسی و تجزیه و تحلیلهای مبتنی بر دادهها دارد و این کتاب به خوبی این نقش را برجسته کرده است.
Welcome to an exploration of graphical excellence and the art of presenting data. The Visual Display of Quantitative Information stands as a seminal text in the world of data visualization, offering timeless insights and practical techniques for creating informative and beautiful data representations.
Detailed Summary of the Book
Edward R. Tufte's The Visual Display of Quantitative Information is a foundational book in the field of data visualization. With a focus on clarity, precision, and efficiency, Tufte charts a path through the rigorous world of statistical graphics and charts. The book emphasizes the importance of transforming complex data into intelligent and enlightening visualizations that reveal the story behind the numbers without distortion.
The book is divided into two main parts. The first part focuses on theorizing quantitative designs and critiquing deceptive and meaningless visualizations. Tufte provides an engaging discussion on the ethics of graphical representations, highlighting the pitfalls of exaggerating data through misleading graphics. He also introduces the concepts of data-ink ratio and chartjunk, which have become central teachings in the field.
The second part presents a beautifully curated collection of graphical success stories and nightmare scenarios. Here, Tufte meticulously analyzes the effectiveness of historical and contemporary graphics, offering a wide range of examples. From William Playfair's line graphs and scatterplots to Charles Minard’s famous depiction of Napoleon’s Russian campaign, each case study serves to illustrate principles of effective visual storytelling.
Key Takeaways
- Principles of Graphical Excellence: The book defines graphical excellence as that which gives the viewer the greatest number of ideas in the shortest time with the least ink and in the smallest space.
- Data-Ink Ratio: Tufte advocates for maximizing the data-ink ratio, essentially reducing non-essential ink to let the substance of the data shine.
- Simplicity and Clarity: Tufte insists on simplifying presentations to ensure clarity, suggesting that visual designs should be as simple as possible yet as complex as necessary.
- Critique of Chartjunk: The book strongly opposes unnecessary decoration in graphics, often referred to as chartjunk, which can distract from the data.
Famous Quotes from the Book
"Above all else show the data."
"Clutter and confusion are failures of design, not attributes of information."
"The greatest value of a picture is when it forces us to notice what we never expected to see."
Why This Book Matters
The Visual Display of Quantitative Information has established itself as an invaluable resource in the toolkit of anyone involved in data science, analytics, or any field requiring data communication. Its enduring relevance stems from its unwavering commitment to honesty and clarity, challenging viewers and creators alike to aim for truth in their visual representations.
In a world increasingly driven by data, it is crucial for professionals to present information in a way that is not only accurate but also easily digestible and engaging. Tufte's rigorous method serves as a vital guide for aspiring designers, ensuring that visualizations do not just inform, but also perform excellently in educating and enlightening audiences.
Ultimately, the book is a call to excellence, urging creators to respect their audience by upholding the highest standards of design and integrity. Tufte's work has shaped the industry norms we honor today and continues to inspire new generations of data storytellers.
دانلود رایگان مستقیم
شما میتونید سوالاتتون در باره کتاب رو از هوش مصنوعیش بعد از ورود بپرسید
دسترسی به کتابها از طریق پلتفرمهای قانونی و کتابخانههای عمومی نه تنها از حقوق نویسندگان و ناشران حمایت میکند، بلکه به پایداری فرهنگ کتابخوانی نیز کمک میرساند. پیش از دانلود، لحظهای به بررسی این گزینهها فکر کنید.
این کتاب رو در پلتفرم های دیگه ببینید
WorldCat به شما کمک میکنه تا کتاب ها رو در کتابخانه های سراسر دنیا پیدا کنید
امتیازها، نظرات تخصصی و صحبت ها درباره کتاب را در Goodreads ببینید
کتابهای کمیاب یا دست دوم را در AbeBooks پیدا کنید و بخرید
1440
بازدید4.6
امتیاز0
نظر98%
رضایتنظرات:
4.6
بر اساس 0 نظر کاربران
Questions & Answers
Ask questions about this book or help others by answering
No questions yet. Be the first to ask!




![Data Mining Concepts and Techniques [Solution Manual]](https://s3.refhub.ir/images/thumb/Data_Mining_Concepts_and_Techniques__Solution_9192.webp)
