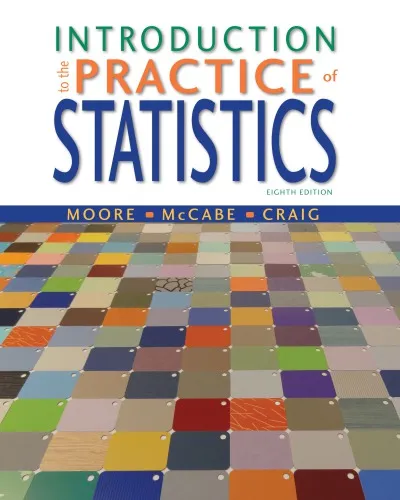
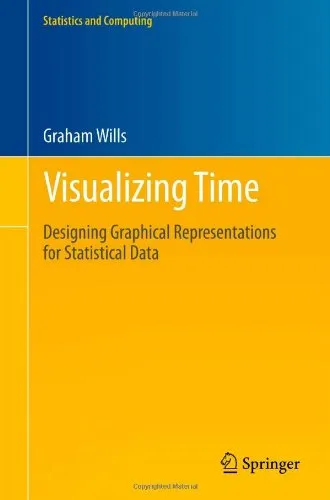
Visualizing Time: Designing Graphical Representations for Statistical Data
4.0
بر اساس نظر کاربران

شما میتونید سوالاتتون در باره کتاب رو از هوش مصنوعیش بعد از ورود بپرسید
هر دانلود یا پرسش از هوش مصنوعی 2 امتیاز لازم دارد، برای بدست آوردن امتیاز رایگان، به صفحه ی راهنمای امتیازات سر بزنید و یک سری کار ارزشمند انجام بدینکتاب های مرتبط:
معرفی کتاب
کتاب Visualizing Time: Designing Graphical Representations for Statistical Data یک منبع جامع و ضروری برای پژوهشگران علوم داده، طراحان گرافیک و تحلیلگران است که به دنبال درک و بیان بهتر دادههای آماری مرتبط با زمان هستند. نوشته "گراهام ویلز"، این کتاب با تمرکز خاص بر زمانبندی و نمایش اطلاعات زمانی، اصول و روشهایی برای طراحی نمایشهای گرافیکی موثر را ارائه میدهد.
خلاصه کتاب
Visualizing Time به طور کامل به بررسی چگونگی ارائه دادههای زمانی میپردازد و در این فرآیند از ترکیب اصول طراحی گرافیکی و درک روانشناسی بصری بهره میگیرد. این کتاب شامل توضیحات فنی، مثالهای عملی و مقایسههای دیداری است که به شما کمک میکند تا ایدههای پیچیده زمانی را به روشهایی بصری و شفاف انتقال دهید.
همچنین کتاب به تحلیل ابزارهای موجود، تکنیکهای پیشرفته و مزیتها و نقاط ضعف انواع مختلف گرافهای زمانی، مانند Time-Series و Gantt Chart، میپردازد. نویسنده با نگاهی نظاممند عناصر مختلفی همچون رنگ، مقیاس، موقعیت و تعاملپذیری را بررسی کرده و چارچوبی برای انتخاب الگوی مناسب ارائه میدهد.
نکات کلیدی از کتاب
- چگونگی طراحی فریمورکهای قابل درک برای گرافهای زمانی پیچیده.
- اختصاصیسازی Time-Series بر اساس کاربردها و حوزههای مختلف.
- اهمیت ترکیب مؤثر رنگ و موقعیت در گرافیک های زمانی.
- تحلیل دادههای گذشتهنگر و پیشبینانه با تمرکز بر نمایش بصری.
- ابزارهای مدرن و نرمافزارهای مرتبط برای Visualization.
جملات معروف از کتاب
"Effective visualization is not just about making data look good; it's about making data understood."
"Time is not just a dimension; it is the heart of every story."
چرا این کتاب مهم است؟
کتاب Visualizing Time به دلیل دیدگاههای نوآورانه و کاربردیاش در دنیای امروز، که دادهها یکی از باارزشترین داراییها محسوب میشوند، اهمیت بسیاری دارد. این کتاب به شما نشان میدهد که چگونه دادههای پیچیده را به نمایشی قابل فهم و گویا تبدیل کنید، بنابراین میتواند برای طیف گستردهای از مخاطبان، از تحلیلگران داده تا مدیران تصمیمگیر بسیار ارزشمند باشد. همچنین، تمرکز بر روی اصول علمی و فنی همراه با ارائه ملموسترین شیوهها، به این کتاب جایگاه ویژهای در حوزه Data Visualization اختصاص داده است.
Introduction to "Visualizing Time: Designing Graphical Representations for Statistical Data"
"Visualizing Time: Designing Graphical Representations for Statistical Data" is a comprehensive guide for anyone looking to effectively represent temporal data through visuals. Authored by Graham Wills, this book explores the art and science of creating time-focused graphical representations that are both insightful and aesthetically engaging. Through its structured approach, the book demonstrates how to analyze complex time-dependent datasets and best practices for presentation. Readers gain a wealth of knowledge covering theoretical concepts, practical applications, and innovative techniques for designing time-based data visualizations.
A Detailed Summary of the Book
This book delves deeply into the realm of data visualization, with a particular focus on depicting temporal patterns. Time is one of the most critical dimensions in understanding data trends and their evolution, making its graphical representation a core skill for statisticians, designers, and analysts. The author provides a step-by-step path to design visualizations that are tailored to temporal data while considering critical characteristics like order, granularity, and frequency.
From traditional approaches such as line graphs and bar charts to more complex visualizations like time glyphs and spiral plots, the book explains the strengths and weaknesses of various techniques. It also highlights when to use certain methods for optimal communication. Examples include everything from daily stock market trends to decades-long climate change data.
Readers also benefit from practical case studies and coding exercises, where they can put the theories into action. The book complements technical detail with an emphasis on storytelling — teaching you how to craft a narrative through visuals so that your data resonates with audiences.
Key Takeaways
- A deep understanding of temporal data and its unique challenges in visualization.
- Mastery of a variety of methodologies for creating time-dependent graphics.
- Guidelines for matching visualization techniques to the specific type of time data you have, such as periodic, sequential, or irregular data.
- Real-world applications of statistical theory in graphic design.
- The importance of storytelling in data visualization, especially when displaying time series data.
Famous Quotes from the Book
"Time is the thread that connects all data together. Without it, we lose our sense of context, history, and progression."
"A well-designed time visualization reveals not just the obvious trends but also the subtle shifts that shape the narrative."
"Clarity should always triumph over complexity. Simpler graphics often carry more weight than intricate designs."
Why This Book Matters
In a world where vast amounts of temporal data are generated every second, the ability to effectively visualize time is an invaluable skill. Whether you're a data analyst, business leader, academic researcher, or designer, "Visualizing Time" equips you with cutting-edge tools and methodologies to decode temporal trends and present them compellingly.
Many books focus on general data visualization, but few offer such specific attention to the intricacies of time representation. The author's detailed guidance ensures that you don't just create visually appealing graphs but also ones that are meaningful and impactful. With its balance of theoretical grounding and practical advice, this book is essential reading for anyone working with time data.
دانلود رایگان مستقیم
شما میتونید سوالاتتون در باره کتاب رو از هوش مصنوعیش بعد از ورود بپرسید
دسترسی به کتابها از طریق پلتفرمهای قانونی و کتابخانههای عمومی نه تنها از حقوق نویسندگان و ناشران حمایت میکند، بلکه به پایداری فرهنگ کتابخوانی نیز کمک میرساند. پیش از دانلود، لحظهای به بررسی این گزینهها فکر کنید.
این کتاب رو در پلتفرم های دیگه ببینید
WorldCat به شما کمک میکنه تا کتاب ها رو در کتابخانه های سراسر دنیا پیدا کنید
امتیازها، نظرات تخصصی و صحبت ها درباره کتاب را در Goodreads ببینید
کتابهای کمیاب یا دست دوم را در AbeBooks پیدا کنید و بخرید
1177
بازدید4.0
امتیاز0
نظر98%
رضایتنظرات:
4.0
بر اساس 0 نظر کاربران
Questions & Answers
Ask questions about this book or help others by answering
No questions yet. Be the first to ask!




![Good Charts, Updated and Expanded: The HBR Guide to Making Smarter, More Persuasive Data Visualizations [Team-IRA]](https://s3.refhub.ir/images/thumb/Good_Charts__Updated_and_Expanded__The_HBR_Gu_31517.webp)


