📚 چرا کتاب فیزیکی بخریم؟
- ✅ کیفیت چاپ عالی و کاغذ مرغوب
- ✅ راحتی مطالعه بدون نیاز به دستگاه
- ✅ امکان یادداشتبرداری و هایلایت
- ✅ تحویل سریع در سراسر کشور
قیمت نهایی کتاب
439,000 تومان
شامل چاپ و صحافیلذت ورق زدن یک کتاب واقعی
- سال انتشار: 2008
- صفحات: 384
- اندازه فایل: 6 MB
- زبان: English
- انتشارات: O'Reilly Media
- تعداد مشاهده: 645
- امتیاز کاربران: 4.4
-
شابک/ISBN:
0596514557
9780596514556
کلمات کلیدی:

کانال تلگرام امین مصباحی
تِکافترنون، رویدادی گاهبهگاه است با موضوعات حول معماری و توسعه نرمافزار، این کانال هم برای اشتراک اخبار، آموزش، نکاتی حول مهندسی نرمافزار، دیتابیس، تکنولوژی و مدیریت تولید محصولات نرمافزاری خواهد بود. امین مصباحی
مشاهده بیشترVisualizing Data
4.4
بر اساس نظر کاربران

شما میتونید سوالاتتون در باره کتاب رو از هوش مصنوعیش بعد از ورود بپرسید
هر دانلود یا پرسش از هوش مصنوعی 2 امتیاز لازم دارد، برای بدست آوردن امتیاز رایگان، به صفحه ی راهنمای امتیازات سر بزنید و یک سری کار ارزشمند انجام بدین


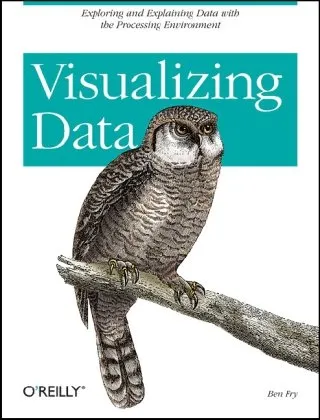
معرفی کامل کتاب "Visualizing Data"
کتاب "Visualizing Data" اثری از من، بن فرای، یکی از منابع برجسته در زمینه تجسم دادههاست که راهنمایی جامع برای تبدیل دادههای خام به تصاویری قابل فهم ارائه میدهد. این کتاب نه تنها به تکنیکها و اصول تجسم داده میپردازد، بلکه رویکردهای کاربردی و ابزارهایی مانند Processing را نیز توضیح میدهد که به طور خاص برای خلق گرافیک تعاملی طراحی شده است.
خلاصهای جامع از کتاب
این کتاب از مراحل اولیه جمعآوری دادهها تا تولید گرافیک نهایی که برای ارائه مناسب است، خواننده را هدایت میکند. من در این کتاب مراحل و فرایندهای مختلف کار با دادهها، از جمله پاکسازی، تحلیل، و خلق نمودارها و گرافیکهای پیچیده را با جزئیات شرح دادهام. برای هر مرحله راهحلها و ابزارهای متعددی ارائه شده که به کاربران کمک میکند به شکلی آگاهانه و موثر دادهها را مدیریت کنند. محور اصلی کتاب بر روی درک عمیق از ساختار داده و چگونگی ارتباط آن با مخاطبان تمرکز دارد. درواقع، کتاب به خوانندگان کمک میکند که دادههای پیچیده را از یک دیدگاه بصری و ساختاری تحلیل و ارائه کنند.
یکی از جنبههای کلیدی "Visualizing Data" استفاده از Processing به عنوان ابزار انتخابی برای نمایش دادههاست. این زبان برنامهنویسی ساده و انعطافپذیر به کاربران این امکان را میدهد که نمونههای تعاملی و گرافیکهای سفارشی تولید کنند. در طول کتاب سعی شده است نمونههای واقعی و عملی ارائه شود تا شما بتوانید مفاهیم را بهتر درک کرده و به سادگی به کار ببندید.
کلید واژهها و نتایج مهم کتاب
مطالعه این کتاب به شما مهارتهای زیر را ارائه میکند:
- یادگیری اصول تجسم دادهای که به سادهسازی و ارتباط موثر دادهها کمک میکند.
- آشنایی با فرایند تحلیل دادهها از مرحله جمعآوری تا ساخت نمودارهای بصری.
- استفاده خلاقانه و تکنیکی از ابزار Processing برای خلق گرافیکهای سفارشی.
- افزایش توانایی درک مخاطبان و مطابقسازی گرافیکها برای انتقال سریع و دقیق اطلاعات.
- ایجاد فهم عمیق نسبت به اینکه چگونه گرافیکها میتوانند دادههای پیچیده را تسهیل کنند.
جملات معروف از کتاب
"A huge portion of the world’s information can be understood only when it is visualized."
"Data without context is meaningless. Context brings depth and insight."
چرا این کتاب اهمیت دارد؟
اهمیت "Visualizing Data" به دلیل ترکیب بدیع تئوریها و روشهای عملی برای کار با داده است. ما در عصر داده زندگی میکنیم؛ جایی که داشتن مهارت تجسم داده برای هرکسی که در حوزه دادهها کار میکند، ضروری است. این کتاب به عنوان منبعی پایهای و پیشرفته به همه متخصصین، طراحان اطلاعات، برنامهنویسان و حتی کسانی که میخواهند وارد دنیای داده شوند، توصیه میشود. یکی از ویژگیهای برجسته این کتاب رویکردی گامبهگام است که به خواننده اجازه میدهد نه تنها مفاهیم پایه را بیاموزد، بلکه مهارتهای پیشرفتهای نیز کسب کند.
این اثر میتواند تغییری بزرگ در نحوهای که به دادهها نگاه میکنید و آنها را ارائه میدهید، ایجاد کند. همچنانکه اطلاعات بزرگتر و پیچیدهتر میشود، داشتن ابزارها و تکنیکهای مناسب برای درک و انتقال آنها اهمیت بیشتری پیدا میکند. کتاب "Visualizing Data" شما را برای این چالش آماده میکند.
Introduction to Visualizing Data
Visualizing Data by Ben Fry is a groundbreaking guide to the art and science of data visualization. The book offers a comprehensive and methodical approach to turning large, complex datasets into clear, captivating visuals. Written by a pioneer in computational design, this book emphasizes not only the technical skills needed to create effective visualizations but also the design practices that make them impactful and meaningful.
Data visualization has become an indispensable tool for understanding and communicating complex ideas in the modern world. Whether you're working with statistical information, scientific data, or financial trends, the ability to transform raw data into readable and engaging visual outputs is a skill of growing importance. This book is specifically tailored to help individuals of all backgrounds—be it developers, designers, analysts, or educators—build this skill step-by-step.
With a focus on combining technical mastery with creative thinking, Visualizing Data equips readers with the tools they need to illuminate insights and tell compelling data stories. As you dive into its insights, you'll discover why this book remains one of the most respected resources on effective visualization methods.
Detailed Summary of the Book
Visualizing Data follows a structured framework that walks readers through the entire process of generating data visualizations, starting from scratch. It introduces the concept of a seven-step framework, which acts as the foundation for understanding, processing, and representing data. These steps are:
- Acquire: Obtain the dataset you want to analyze.
- Parse: Organize and format the data so that it can be analyzed.
- Filter: Clean and refine the dataset to focus on relevant information.
- Mine: Extract meaningful patterns and derive insights.
- Represent: Choose the right visual model or metaphor to communicate the data.
- Refine: Polish the visualization to improve clarity, aesthetics, and usability.
- Interact: Add user interaction or customization when applicable.
The book is primarily written with the Processing programming language, a tool crafted specifically with visual and computational design in mind. Key concepts like scaling, mapping, and layout are explained in detail using examples from practical projects. Readers will learn to develop both static and interactive visual representations of data, with particular emphasis on understanding the stories hidden within datasets. It's not just about converting data into charts—it's about transforming data into meaningful communication.
Key Takeaways
Here are some of the most important lessons you'll learn from Visualizing Data:
- How to approach data visualization as both a science and an art form.
- The significance of storytelling in creating effective visualizations.
- Principles of design that enhance understanding and user engagement.
- Step-by-step instructions for creating visualizations using the Processing language.
- The importance of refining and tailoring visualizations to their audience and context.
- A systematic, repeatable process for tackling datasets of any complexity or size.
- How to think critically about data representation choices to avoid misleading narratives.
By the end of this book, you will not only understand how to create visualizations but also why certain methods are more effective than others. You will develop a keen eye for evaluating existing visual designs and generating your own with confidence.
Famous Quotes from the Book
Visualizing Data is packed with insightful observations on the creative and technical process of data representation. Some of the most memorable quotes include:
"Data is a powerful narrative tool. It can tell stories that words cannot."
"The goal of visualization is not to simplify, but to clarify."
"Effective representations reveal the most important parts of the data while deliberately hiding the rest."
These quotes reflect the book's emphasis on balance—using data visualization to unravel complexity while maintaining precision and integrity.
Why This Book Matters
Visualizing Data holds a unique place in the fields of data science and design. It bridges two critical domains—technical programming skills and creative visual storytelling. In an age where data drives decisions at every level, this book provides the blueprint to make complex information accessible to diverse audiences.
What sets Visualizing Data apart is its holistic approach. Instead of focusing solely on tools or software, it prioritizes the thought process and strategy behind visualization. This makes it valuable not just for beginners, but also for seasoned professionals seeking to refine their craft.
For anyone striving to make data more meaningful, engaging, and visually compelling, this book is an essential resource. It's a powerful reminder that data, when thoughtfully visualized, has the potential to transform ideas, spark action, and change perspectives.
دانلود رایگان مستقیم
شما میتونید سوالاتتون در باره کتاب رو از هوش مصنوعیش بعد از ورود بپرسید
دسترسی به کتابها از طریق پلتفرمهای قانونی و کتابخانههای عمومی نه تنها از حقوق نویسندگان و ناشران حمایت میکند، بلکه به پایداری فرهنگ کتابخوانی نیز کمک میرساند. پیش از دانلود، لحظهای به بررسی این گزینهها فکر کنید.
این کتاب رو در پلتفرم های دیگه ببینید
WorldCat به شما کمک میکنه تا کتاب ها رو در کتابخانه های سراسر دنیا پیدا کنید
امتیازها، نظرات تخصصی و صحبت ها درباره کتاب را در Goodreads ببینید
کتابهای کمیاب یا دست دوم را در AbeBooks پیدا کنید و بخرید
