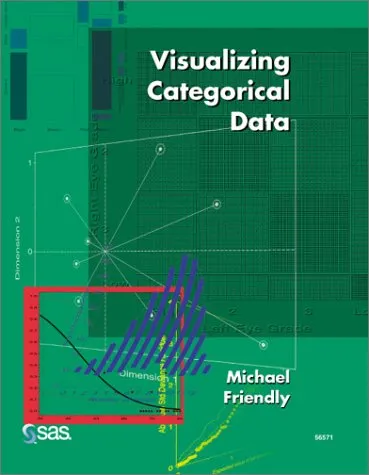
Visualizing Categorical Data
4.6
بر اساس نظر کاربران

شما میتونید سوالاتتون در باره کتاب رو از هوش مصنوعیش بعد از ورود بپرسید
هر دانلود یا پرسش از هوش مصنوعی 2 امتیاز لازم دارد، برای بدست آوردن امتیاز رایگان، به صفحه ی راهنمای امتیازات سر بزنید و یک سری کار ارزشمند انجام بدینکتاب های مرتبط:
خلاصه تحلیلی کتاب
کتاب Visualizing Categorical Data بهعنوان یکی از آثار مهم در حوزه آماری و دادهکاوی، بر ارائه روشها و تکنیکهای پیشرفته برای نمایش و تحلیل دادههای طبقهبندیشده تمرکز دارد. این کتاب رویکردی نظاممند و عمیق به گرافیک آماری دارد و از ابتدا تا انتها تلاش میکند تا خواننده را با مفهوم و کاربردهای گسترده این نوع دادهها آشنا سازد.
مولف کتاب، با بهرهگیری از سالها تجربه عملی در تحلیل داده، مثالهای متعدد و تصاویر گویا را ارائه کرده است تا مفاهیم پیچیده به شکلی قابل فهم و در عین حال علمی منتقل شوند. در بخشهای مختلف، روشهایی چون mosaic plots، association plots، و fourfold displays به زبان ساده ولی دقیق معرفی شده و مزایا و محدودیتهای هر یک بحث شده است.
این اثر صرفاً یک مجموعه آموزشی ساده نیست؛ بلکه مخاطب را به تأمل درباره نحوه درک روابط بین متغیرهای کیفی و استفاده از ابزارهای تصویری برای ارتقای دقت تحلیل فرامیخواند. با توجه به مخاطبان پژوهشگر و کتابخوانهای جدی، ساختار کتاب به گونهای طراحی شده تا فهم عمیقتری از تعامل بین تئوری و کاربرد عملی فراهم گردد.
نکات کلیدی و کاربردی
یکی از نکات برجسته کتاب، تمرکز بر ابزارهای گرافیکی تعاملی و روشهای نو برای بازنمایی دادههای طبقهبندیشده است. این تمرکز باعث میشود که خواننده بتواند از چارچوبهای موجود فراتر رود و الگوهای پنهان در دادهها را بهتر مشاهده کند.
در بخشهای عملی کتاب، نحوه استفاده از نرمافزارها و بستههای آماری برای تولید Visualizations دقیق و قابل اعتماد توضیح داده شده است. این بخش، به فعالان حوزه گرافیک آماری کمک میکند تا با مجموعهای از تکنیکها و ابزارها آشنا شوند و بتوانند در پروژههای واقعی به کار گیرند.
کتاب همچنین توصیههایی برای انتخاب روش مناسب در شرایط مختلف ارائه میدهد؛ این توصیهها مبتنی بر تجربه و مطالعات موردی هستند و به پژوهشگران کمک میکند تا تصمیمگیریهای مبتنی بر شواهد داشته باشند.
نقلقولهای ماندگار
در طول مطالعه کتاب، با جملاتی روبهرو میشوید که نهتنها جنبه آموزنده دارند، بلکه دیدگاه شما درباره دادهها را متحول میکنند. برخی از این جملات، بهعنوان چکیده تجربه و بینش نویسنده، ارزش ماندگار دارند.
دادههای طبقهبندیشده همانند زبان هستند؛ تنها با تصویرسازی دقیق میتوان معنای نهفته آنها را فهمید. نامشخص
هر Visualization پنجرهای است به یک داستان؛ داستانی که فقط با درک روابط کیفی کامل میشود. نامشخص
چرا این کتاب اهمیت دارد
اهمیت این کتاب در توانایی آن برای ایجاد پیوند میان مفاهیم نظری و کاربردهای عملی نهفته است. برای پژوهشگران، داشتن ابزاری کارآمد برای تحلیل دادههای طبقهبندیشده، یک ضرورت است و Visualizing Categorical Data این ضرورت را برطرف میسازد.
در دنیای امروز که حجم عظیمی از دادههای کیفی تولید میشود، روشهای سنتی تحلیل کفایت لازم را ندارند. این کتاب، با ارائه راهکارهای نوین بصریسازی، امکان شناخت بهتر الگوها و روابط را فراهم میآورد و به تصمیمگیریهای علمی دقت بیشتری میبخشد.
مولف با ترکیب دانش آماری و تجربه کار با دادههای واقعی، به خواننده نشان میدهد که چگونه Visualization میتواند به ابزاری برای کشف و یادگیری تبدیل شود. این ویژگی باعث شده که کتاب، جایگاه ویژهای در میان منابع آموزشی و پژوهشی به دست آورد.
نتیجهگیری الهامبخش
کتاب Visualizing Categorical Data نهتنها یک منبع آموزشی، بلکه دعوتی است برای ورود به دنیای پیچیده و
Introduction to 'Visualizing Categorical Data'
'Visualizing Categorical Data' by Michael Friendly is an essential guide for understanding and mastering the art of effective data visualization, particularly in the realm of categorical data. Aimed at statisticians, data analysts, researchers, and anyone interested in visual storytelling through data, this book bridges the gap between complex statistical analysis and clear, concise data presentation techniques. In an era where data drives decision-making, the ability to communicate categorical data insights visually has become a vital skill. This book not only helps you learn the theoretical foundation of visualizing categorical data but also equips you with practical tools for applying these concepts to real-world problems.
Detailed Summary of the Book
'Visualizing Categorical Data' dives into the challenges and solutions for representing non-numeric, categorical information through intuitive visualizations. The book begins by explaining the basics of categorical data and why specialized techniques are necessary to understand and communicate patterns effectively. From two-way and multi-way tables to advanced correspondence analyses, mosaic plots, and logistic regression visualization, the book offers a wide arsenal of graphical methods tailored to categorical data structures.
Structured into cohesive chapters, the book thoroughly addresses the intricacies of association, relationships, and trends in categorical datasets. Whether you are dealing with demographic, survey, or experimental data, the rigorous explanations and examples provided guide you step-by-step in crafting compelling visual comparisons that are intuitive to interpret. One of its hallmark features is the emphasis on using innovative graphing methods to convey complex data relationships in a meaningful way.
By blending statistical theory, visualization principles, and practical implementation, the book ensures that readers not only understand the "why" but also the "how" of visualizing categorical data effectively. Additionally, the book offers R and SAS code for users, fostering hands-on implementation for readers who are ready to experiment and learn by doing.
Key Takeaways
The book provides invaluable insights and tools for readers who want to enhance their categorical data presentation skills. Below are the key takeaways:
- Learn the essentials of visualizing different types of categorical data, from binary and nominal to ordinal and multi-way data structures.
- Master the usage of advanced visualization techniques such as mosaic plots, association plots, and correspondence analysis to reveal hidden relationships.
- Understand the statistical principles behind effective visualization to ensure accuracy and integrity in data reporting.
- Gain practical knowledge with R and SAS implementations, demonstrating how to bring theoretical concepts into modern data-analysis workflows.
- Enhance your ability to communicate insights visually, fostering better understanding and more effective decision-making.
Famous Quotes from the Book
Throughout the book, Michael Friendly not only provides technical guidance but also weaves in thought-provoking ideas that elevate the reader's understanding of data visualization. Here are some notable quotes:
"The purpose of a graph is insight, not numbers."
"Visualizations reveal the unseen structures and relationships in categorical data that might otherwise escape notice."
"Effective data communication lies at the intersection of clarity, creativity, and context-specific analysis."
Why This Book Matters
In today's data-driven world, the ability to make sense of categorical data and communicate its insights has grown increasingly vital. From policymaking and scientific research to business analytics and beyond, categorical data plays a critical role in driving meaningful insights. However, standard numerical visualization techniques often fail to do justice to the relationships and patterns found within categorical datasets. This is where 'Visualizing Categorical Data' truly shines.
The book serves as a comprehensive guide to visualizing the structure and relationships in categorical data, providing readers with robust solutions for transforming raw tabular data into actionable insights. Its focus on interpretability, reproducibility, and methodological integrity ensures that readers not only gain technical expertise but also cultivate an ethical and impactful approach to data visualization.
Furthermore, Michael Friendly's approachable yet authoritative tone ensures that complex statistical methods are rendered accessible for both novice statisticians and seasoned experts. By championing innovation in visualization and emphasizing the importance of visual presentation, this book sets itself apart as an essential resource in the realm of data visualization literature.
دانلود رایگان مستقیم
شما میتونید سوالاتتون در باره کتاب رو از هوش مصنوعیش بعد از ورود بپرسید
دسترسی به کتابها از طریق پلتفرمهای قانونی و کتابخانههای عمومی نه تنها از حقوق نویسندگان و ناشران حمایت میکند، بلکه به پایداری فرهنگ کتابخوانی نیز کمک میرساند. پیش از دانلود، لحظهای به بررسی این گزینهها فکر کنید.
این کتاب رو در پلتفرم های دیگه ببینید
WorldCat به شما کمک میکنه تا کتاب ها رو در کتابخانه های سراسر دنیا پیدا کنید
امتیازها، نظرات تخصصی و صحبت ها درباره کتاب را در Goodreads ببینید
کتابهای کمیاب یا دست دوم را در AbeBooks پیدا کنید و بخرید
1455
بازدید4.6
امتیاز0
نظر98%
رضایتنظرات:
4.6
بر اساس 0 نظر کاربران
Questions & Answers
Ask questions about this book or help others by answering
No questions yet. Be the first to ask!
