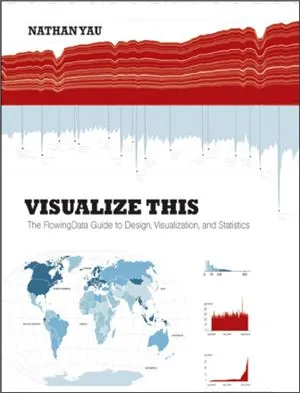
Visualize This: The FlowingData Guide to Design, Visualization, and Statistics
4.5
بر اساس نظر کاربران

شما میتونید سوالاتتون در باره کتاب رو از هوش مصنوعیش بعد از ورود بپرسید
هر دانلود یا پرسش از هوش مصنوعی 2 امتیاز لازم دارد، برای بدست آوردن امتیاز رایگان، به صفحه ی راهنمای امتیازات سر بزنید و یک سری کار ارزشمند انجام بدینکتاب های مرتبط:
معرفی کتاب "Visualize This: The FlowingData Guide to Design, Visualization, and Statistics"
کتاب "Visualize This: The FlowingData Guide to Design, Visualization, and Statistics" یک راهنمای جامع برای طراحی و نمایش دادهها است، که برای کسانی که به استفاده از دادهها برای قصهگویی بصری علاقهمندند، نوشته شده است.
خلاصهای از کتاب
این کتاب به بررسی اصول بنیادین طراحی و نمایش دادهها میپردازد و نحوه استفاده از ابزارهایی همچون R, Excel, و Adobe Illustrator را برای ایجاد تصاویر دادهای خلاقانه توضیح میدهد. نویسنده، Yau Nathan، به خوانندگان نشان میدهد چگونه با استفاده از دادههای ترکیبی و بصری، قصههای پیچیدهای را روایت کنند که مخاطب را تحت تاثیر قرار دهد. این اثر بهطور خاص بر اهمیت Context در Visualization تأکید میکند و صنایع مختلفی را مورد بررسی قرار میدهد که در آنها دادهها به روشهای نوآورانه به کار گرفته شدهاند.
مطالب کلیدی
- اهمیت Context در Visualization و چگونگی تاثیربخشی آن بر فهم دادهها.
- آشنایی با تکنیکهای مختلف طراحی بصری و استفاده از ابزارهای گرافیکی.
- نحوه انتخاب و نمایش دادهها برای داستانگویی موثر و جذاب.
- بررسی مطالعات موردی از صنایع مختلف برای استفاده موفق از دادهها.
نقلقولهای معروف از کتاب
"Visualization is about information, not pretty pictures." - Yau Nathan
"The best way to understand data is to visualize it." - Yau Nathan
چرا این کتاب اهمیت دارد
در عصر اطلاعات، توانایی تبدیل دادههای خام به بینشهای عملی از اهمیت فوقالعادهای برخوردار است. این کتاب بهطور مفصل نحوه انجام این کار را توضیح میدهد و خوانندگان را مجهز میکند تا بتوانند با اعتماد به نفس از تکنیکهای مختلف Visualization استفاده کنند. با در نظر گرفتن نیازهای متنوع در هر صنعتی، این اثر به طور خاص میتواند به بهبود مهارتهای طراحی و Analytics کسانی که در کسبوکارها، علم داده و حتی هنر فعالیت میکنند، کمک کند.
Dive into the world of data visualization with 'Visualize This: The FlowingData Guide to Design, Visualization, and Statistics,' a comprehensive guide that illuminates the transformative power of data when made visible. Crafted by Yau Nathan, this book is an essential resource for anyone wanting to learn how to convey data insights effectively through beautiful and compelling visual stories.
Detailed Summary of the Book
Yau Nathan takes readers on a journey through the fundamental concepts of data visualization, combining statistical expertise with creative design. 'Visualize This' is structured to progressively impart knowledge, starting from the basics of data handling to the subtleties of presenting data in intuitive and aesthetically pleasing forms. The book covers various tools and software options, mostly focusing on accessible and open-source platforms like R and Python, which are favored for their flexibility and power in creating custom visualizations.
Throughout, the book emphasizes the importance of storytelling in data visualization, teaching how to craft narratives that engage audiences beyond mere numbers. Yau provides detailed, step-by-step tutorials on achieving professional-grade results, including practical examples and case studies that reiterate the book's teachings, helping readers consolidate their learning with practice.
Key Takeaways
- Understanding Data: Learn how to process and interpret data effectively before embarking on visualization.
- Visualization Techniques: Explore various graphic methods, including charts, graphs, and maps tailored to different data types and objectives.
- Design Principles: Grasp the aesthetics of data representation, balancing clarity with appeal.
- Storytelling with Data: Master the art of conveying messages through data-driven stories that captivate and inform the audience.
Famous Quotes from the Book
“The goal is to turn data into information, and information into insight.”
“Data is like a canvas: without an artist, it’s just a slab.”
Why This Book Matters
In an era overwhelmed by data, the ability to present that data intelligibly and attractively is invaluable. 'Visualize This' is not just a guide; it's an empowering tool for professionals across multiple industries including journalism, academics, and business sectors, who seek to leverage data's potential to tell their stories effectively. Yau Nathan's expertise lays down a robust foundation for anyone eager to enter the field of data science or those who wish to refine their skills. Leveraging both practical insights and conceptual fundamentals, the book helps demystify complex data visualization topics, ensuring accessibility without sacrificing depth.
دانلود رایگان مستقیم
شما میتونید سوالاتتون در باره کتاب رو از هوش مصنوعیش بعد از ورود بپرسید
دسترسی به کتابها از طریق پلتفرمهای قانونی و کتابخانههای عمومی نه تنها از حقوق نویسندگان و ناشران حمایت میکند، بلکه به پایداری فرهنگ کتابخوانی نیز کمک میرساند. پیش از دانلود، لحظهای به بررسی این گزینهها فکر کنید.
این کتاب رو در پلتفرم های دیگه ببینید
WorldCat به شما کمک میکنه تا کتاب ها رو در کتابخانه های سراسر دنیا پیدا کنید
امتیازها، نظرات تخصصی و صحبت ها درباره کتاب را در Goodreads ببینید
کتابهای کمیاب یا دست دوم را در AbeBooks پیدا کنید و بخرید
1464
بازدید4.5
امتیاز0
نظر98%
رضایتنظرات:
4.5
بر اساس 0 نظر کاربران
Questions & Answers
Ask questions about this book or help others by answering
No questions yet. Be the first to ask!

![Data Mining Concepts and Techniques [Solution Manual]](https://s3.refhub.ir/images/thumb/Data_Mining_Concepts_and_Techniques__Solution_9192.webp)
