📚 چرا کتاب فیزیکی بخریم؟
- ✅ کیفیت چاپ عالی و کاغذ مرغوب
- ✅ راحتی مطالعه بدون نیاز به دستگاه
- ✅ امکان یادداشتبرداری و هایلایت
- ✅ تحویل سریع در سراسر کشور
قیمت نهایی کتاب
489,000 تومان
شامل چاپ و صحافیلذت ورق زدن یک کتاب واقعی
- سال انتشار: 2013
- صفحات: 434
- اندازه فایل: 76 MB
- زبان: English
- انتشارات: Wiley
- تعداد مشاهده: 345
- امتیاز کاربران: 4.0
-
شابک/ISBN:
1118388038
9781118388037
کلمات کلیدی:

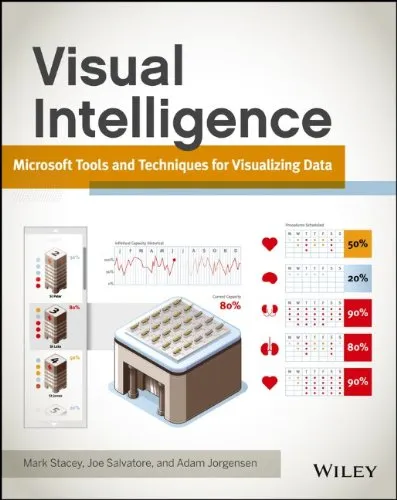
Visual Intelligence: Microsoft Tools and Techniques for Visualizing Data
4.0
بر اساس نظر کاربران

شما میتونید سوالاتتون در باره کتاب رو از هوش مصنوعیش بعد از ورود بپرسید
هر دانلود یا پرسش از هوش مصنوعی 2 امتیاز لازم دارد، برای بدست آوردن امتیاز رایگان، به صفحه ی راهنمای امتیازات سر بزنید و یک سری کار ارزشمند انجام بدین

معرفی کتاب
کتاب Visual Intelligence: Microsoft Tools and Techniques for Visualizing Data یک راهنمای جامع برای کسانی است که قصد دارند از ابزارهای مدرن Microsoft برای تجسم دادهها در فرآیند تصمیمگیری استفاده کنند. این اثر توسط Mark Stacey، Joe Salvatore و Adam Jorgensen نوشته شده و به شما کمک میکند که با ترکیب هنر و علم دادهنگاری (data visualization) تصمیمات هوشمندانهتری بگیرید. با توجه به پیشرفتهای تکنولوژی و اهمیت روزافزون دادهها، این کتاب به شما مهارت استفاده مؤثر از ابزارهای پیشرفتهای نظیر Power BI، SQL Server Reporting Services (SSRS)، Excel و دیگر امکانات Microsoft را میآموزد.
خلاصهای جامع از کتاب
این کتاب به دو بخش اصلی تقسیم میشود: در بخش اول، مفاهیم پایهای و ضروری در مورد تجسم دادهها و اهمیت آن توضیح داده شده است. این بخش به شما نشان میدهد که چرا تجسم دادهها از اهمیت بالایی برخوردار بوده و چگونه میتوانید با استفاده از تکنیکهای علمی، دادهها را به نحوی به نمایش بگذارید که به شفافیت و تصمیمگیری بهتر کمک کند.
بخش دوم کتاب به طور عملی و کاربردی به استفاده از ابزارهای Microsoft برای ایجاد گزارشها، داشبوردها و نمودارهای تعاملی میپردازد. از ساختار اولیه کار با Power BI تا تنظیمات پیشرفته در Excel، همه مراحل به طور دقیق توضیح داده شدهاند. همچنین این کتاب به شما کمک میکند دادهها و شاخصهای کلیدی عملکرد (KPIs) را بهتر تحلیل کنید و تصمیمات استراتژیکتری بگیرید.
نکات کلیدی کتاب
- چگونگی استفاده هوشمندانه از ابزارهای Microsoft برای تجسم دادهها.
- اهمیت تبدیل دادههای خام به اطلاعات عملیاتی از طریق مصورسازی.
- آشنایی با ویژگیهای کلیدی ابزارهایی مانند Power BI و Excel.
- اصول و تکنیکهای طراحی داشبوردهای تعاملی و حرفهای.
- تمرینهایی برای تقویت مهارتهای تجسم دادهها.
- استفاده از بهترین روشهای استاندارد برای انتقال پیام از طریق Visuals.
جملات برجسته از کتاب
"Data is only as useful as the story it tells."
"Visualization is not just about creating beautiful charts; it’s about making an impact."
"Efficiency in decision-making starts with clarity in visualization."
چرا این کتاب مهم است؟
با افزایش حجم دادههایی که روزانه تولید میشوند، توانایی تجزیه و تحلیل این دادهها امری ضروری برای سازمانها و افراد شده است. Visual Intelligence نه تنها ابزارهای مورد نیاز برای تجسم دادهها را معرفی میکند بلکه رویکرد مناسبی برای استفاده بهینه از این ابزارها ارائه میدهد. این کتاب به شما کمک میکند نگاه جدیدی به دادهها داشته باشید و آنها را به شکل مؤثرتری در فرآیندهای کاری خود بهکار ببرید. اگر شما به دنبال بهبود اثربخشی گزارشهای خود هستید یا علاقهمند به ایجاد داشبوردهای حرفهای با ابزارهای Microsoft میباشید، این کتاب برای شما یک منبع فوقالعاده و ضروری است.
Introduction to 'Visual Intelligence: Microsoft Tools and Techniques for Visualizing Data'
In today’s data-driven world, the ability to interpret and communicate insights from data has become a cornerstone of success for businesses and professionals alike. 'Visual Intelligence: Microsoft Tools and Techniques for Visualizing Data' serves as a comprehensive guide to unlocking the power of data visualization using Microsoft’s toolset. Authored by Mark Stacey, Joe Salvatore, and Adam Jorgensen, this book is designed to help beginners and experienced professionals alike master the art of turning raw data into actionable insights through strategic visual representations.
Whether you're a business analyst, a data scientist, or an executive looking to present data in a more impactful way, this book brings together tools, techniques, and best practices that empower you to tell the story behind the numbers effectively. By leveraging cutting-edge Microsoft technologies, readers will learn how to create visually compelling dashboards, reports, and graphics that resonate with stakeholders at all levels.
Summary
'Visual Intelligence' dives deep into the principles of effective data visualization while rooting every concept in real-world applications. The book explores the diverse functionality of Microsoft tools such as Power BI, Excel, and SQL Server Reporting Services, offering step-by-step guides to build powerful visualizations. The authors move beyond basic technical instruction to discuss the psychology of human perception, ensuring that readers not only create meaningful visuals but also align them with how audiences naturally understand and retain information.
From fundamental chart design principles to advanced functionalities like interactive analytics and geospatial mapping, each chapter provides actionable techniques to improve data understanding and storytelling. Readers also learn how to avoid common pitfalls, such as creating overly complex visuals or misrepresenting data. The book emphasizes simplicity, clarity, and the strategic selection of visual elements to maximize impact.
By the end of the book, readers will be equipped with the knowledge to design dashboards that enable smarter decision-making and foster a data-driven culture in any organization.
Key Takeaways
- Learn effective data visualization principles and best practices aligned with human perception.
- Harness the power of Microsoft tools such as Power BI, Excel, and SQL Server Reporting Services for creating stunning visuals.
- Understand how to analyze and present data insights tailored to your audience's needs.
- Avoid common visualization mistakes that can mislead your audience or dilute your message.
- Master the creation of interactive dashboards and reports that drive actionable insights.
- Learn strategies to foster a data-centric mindset within teams and organizations.
Famous Quotes from the Book
"Data visualization is not just about making your reports look better; it's about uncovering hidden patterns and delivering insights that inspire action."
"Great visuals do more than show you the facts—they tell a story that resonates, persuades, and engages."
Why This Book Matters
Incorporating data analytics into decision-making processes is no longer optional for modern organizations—it is a necessity. However, as organizations amass increasingly vast amounts of data, the challenge of presenting that data in a form that informs and inspires grows. That is where 'Visual Intelligence' makes a significant impact.
This book bridges the gap between raw data and informed decision-making. By focusing on the principles of effective visual communication alongside technical expertise, the authors provide a roadmap for professionals looking to elevate their work with clear, impactful visuals. For anyone struggling to make sense of or communicate data, 'Visual Intelligence' equips you with the skills and insights required to succeed in a competitive, data-driven environment.
Ultimately, this book matters because it empowers readers to create meaningful change within their organizations by transforming data into actionable intelligence—an essential skill for modern professionals and businesses.
دانلود رایگان مستقیم
شما میتونید سوالاتتون در باره کتاب رو از هوش مصنوعیش بعد از ورود بپرسید
دسترسی به کتابها از طریق پلتفرمهای قانونی و کتابخانههای عمومی نه تنها از حقوق نویسندگان و ناشران حمایت میکند، بلکه به پایداری فرهنگ کتابخوانی نیز کمک میرساند. پیش از دانلود، لحظهای به بررسی این گزینهها فکر کنید.
این کتاب رو در پلتفرم های دیگه ببینید
WorldCat به شما کمک میکنه تا کتاب ها رو در کتابخانه های سراسر دنیا پیدا کنید
امتیازها، نظرات تخصصی و صحبت ها درباره کتاب را در Goodreads ببینید
کتابهای کمیاب یا دست دوم را در AbeBooks پیدا کنید و بخرید

1345
بازدید4.0
امتیاز0
نظر98%
رضایتنظرات:
4.0
بر اساس 0 نظر کاربران
Questions & Answers
Ask questions about this book or help others by answering
No questions yet. Be the first to ask!