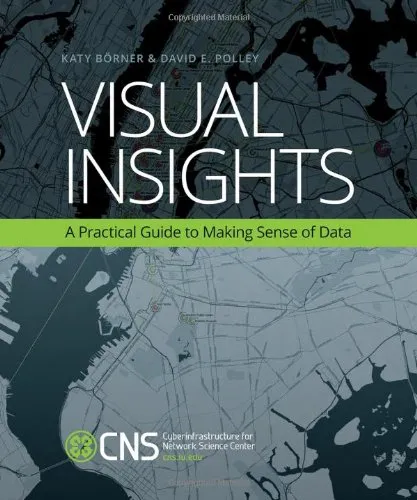
Visual insights : a practical guide to making sense of data
4.5
بر اساس نظر کاربران

شما میتونید سوالاتتون در باره کتاب رو از هوش مصنوعیش بعد از ورود بپرسید
هر دانلود یا پرسش از هوش مصنوعی 2 امتیاز لازم دارد، برای بدست آوردن امتیاز رایگان، به صفحه ی راهنمای امتیازات سر بزنید و یک سری کار ارزشمند انجام بدینمعرفی کتاب: Visual Insights - A Practical Guide to Making Sense of Data
کتاب «Visual Insights: A Practical Guide to Making Sense of Data» به قلم ما، دیوید ای. پلی و کتی بورنر، یکی از منابع کلیدی در درک و کاربرد Data Visualization است. این اثر برای همه افرادی که علاقهمند به تبدیل دادههای پیچیده به نمودارهای قابل فهم هستند، یک راهنمای جامع و کارآمد محسوب میشود. هدف اصلی ما در نگارش این کتاب، فراهم آوردن ابزاری برای تسهیل تحلیل دادهها و انتقال بینشهای به دست آمده از آنها به شکل بصری و مؤثر است. در دنیای امروز که دادهها همهجا هستند، یادگیری ارائهی صحیح آنها به یکی از مهارتهای حیاتی تبدیل شده است.
خلاصهای از کتاب
این کتاب از فصلهای مختلف تشکیل شده است که هر یک، مراحل و مهارتهای ضروری در فرآیند Data Visualization را آموزش میدهد. از مفاهیم اولیه Data cleansing گرفته تا نحوه استفاده از ابزارهای پیشرفته برای تجزیه و تحلیل و طراحی نمودارها و گرافها، کتاب ما خواننده را گام به گام همراهی میکند. یک بخش برجسته این کتاب، ترکیب راهحلهای عملی با تئوری است، به طوری که خوانندگان نه تنها میتوانند نحوه طراحی Visualization را یاد بگیرند، بلکه فلسفه و اصول پشت آن را نیز درک کنند.
ابزارهای مهم مانند Tableau یا Power BI اغلب در تحلیل دادهها مطرح میشوند. در این کتاب به شما میآموزیم چگونه از این ابزارها استفاده کنید تا اطلاعات مورد نظر خود را به بهترین شکل ارائه دهید. علاوه بر این، ما موضوعات دیگری نظیر Data literacy و مبانی چگونگی تعامل انسانها با گرافیک و تصاویر بر اساس تحقیقات روانشناسی را نیز پوشش دادهایم.
نکات کلیدی
- اهمیت ارائه دادهها به صورت بصری برای درک سریعتر و بهتر.
- آموزش نحوه تمیز کردن و آمادهسازی دادهها برای Visualization.
- تکنیکهای ایجاد گرافها و نمودارهای مؤثر که مفهموم را سریعتر منتقل میکنند.
- معرفی ابزارهای Data Visualization و نحوه استفادهی عملی از آنها.
- ترکیب علم روانشناسی و طراحی برای جذاب و ماندگارتر کردن تصاویر دادهای.
جملات معروف از کتاب
"Data is only valuable if it's understandable. Visualization bridges the gap between raw data and meaningful insight."
"The greatest challenge in design is not creating something visually stunning, but creating something that communicates effectively."
"Remember, every graph tells a story—ensure it's the one you intend to tell."
چرا این کتاب اهمیت دارد؟
در دنیای امروز که تصمیمگیریها بر اساس داده انجام میشوند، توانایی انتقال پیامهای حیاتی از طریق Data Visualization به یکی از مهارتهای کلیدی تبدیل شده است. این کتاب شما را قادر میسازد تا حجمهای زیادی از دادهها را به بینشهای معنیدار تبدیل کنید. به این ترتیب، میتوانید ارتباط بین دادهها را بهتر درک کنید و یافتههای خود را به شیوهای کارآمد با دیگران به اشتراک بگذارید.
علاوه بر این، کتاب Visual Insights ابزار و تکنیکهایی را در اختیار شما میگذارد که باعث میشوند ارائهها و تحلیلهای دادهای شما حرفهایتر و جذابتر شوند. بنابراین، این کتاب برای محققان، دانشجویان، متخصصان بازاریابی و هر کسی که به دنبال انتقال مفاهیم پیچیده به روشی ساده است، یک منبع بسیار ارزشمند به شمار میرود.
Introduction to "Visual Insights: A Practical Guide to Making Sense of Data"
In today's data-driven world, the ability to effectively interpret and communicate data has never been more essential. "Visual Insights: A Practical Guide to Making Sense of Data" by Polley, David E. and Börner, Katy is a must-read guidebook for anyone looking to master the art of data visualization. The book takes readers through a comprehensive journey, from understanding raw data to transforming it into meaningful insights that can inform decision-making, spark innovation, and inspire action.
The authors, both of whom have been at the forefront of data science and visualization, provide a clear roadmap for navigating the complex landscape of data. With its rich content, actionable advice, and practical examples, this book equips readers with the tools they need to decode data and present it in visually compelling ways. It is not just a manual for technical experts but a resource for anyone who wants to make data more accessible and impactful, regardless of their background.
Detailed Summary of the Book
"Visual Insights" offers readers a balanced blend of theory and practical advice. The book covers a wide range of topics, making it equally valuable to beginners and seasoned professionals. Each chapter builds on the last, ensuring a structured and logical progression through the material. Below are the major themes explored in the book:
- The principles of effective data visualization: What makes a visual representation clear, accurate, and engaging.
- Tools and techniques: A deep dive into popular software and technologies that aid in crafting impactful visuals.
- Data storytelling: How to combine narrative and graphics to make your data more compelling and memorable.
- Common pitfalls: Avoiding misleading or confusing visualizations that can distort the message behind the data.
- Case studies: Real-world examples of effective data visualization and the lessons behind their success.
From foundational concepts like selecting the right chart type to advanced techniques like interactive dashboards, the book offers something for everyone. The authors also explore the ethical considerations of data visualization and emphasize the importance of integrity and transparency when presenting data.
Key Takeaways
By the end of this book, readers will have a robust understanding of data visualization and will be equipped to tackle real-world challenges. Here are some key takeaways:
- Learn how to identify the right storytelling method for specific datasets and audiences.
- Understand the critical role of aesthetics in enhancing both comprehension and engagement.
- Master the tools and technologies best suited for your specific visualization needs.
- Appreciate the ethical dimensions of representing data fairly and accurately.
- Gain insight into how visualization can influence perceptions and drive impactful decisions.
Famous Quotes from the Book
"Visual Insights" is filled with insightful observations and memorable quotes. Here are some highlights:
"Data by itself is just a collection of numbers. It's the insights we derive from data that truly matter."
"The most successful visualizations don’t just make data beautiful; they make it meaningful."
"Clarity should always take precedence over complexity in data presentation—it’s the key to effective communication."
Why This Book Matters
"Visual Insights" is more than just a guide to data visualization; it’s a roadmap for making sense of the vast amounts of data that permeate every facet of modern life. In an era where information overload is the norm, the ability to distill complex datasets into clear, actionable insights is a critical skill. This book makes that process not only approachable but rewarding.
The authors' expertise shines through in every chapter, offering readers both a strong theoretical foundation and practical tools they can use immediately. The emphasis on ethics and storytelling elevates the book beyond a technical manual, making it relevant and useful for professionals in business, science, education, and government.
In short, "Visual Insights" is an indispensable resource for anyone who wants to transform raw data into something that can educate, persuade, and inspire. It’s a book that bridges the gap between data science and communication, making it a vital resource for the challenges of the 21st century.
دانلود رایگان مستقیم
شما میتونید سوالاتتون در باره کتاب رو از هوش مصنوعیش بعد از ورود بپرسید
دسترسی به کتابها از طریق پلتفرمهای قانونی و کتابخانههای عمومی نه تنها از حقوق نویسندگان و ناشران حمایت میکند، بلکه به پایداری فرهنگ کتابخوانی نیز کمک میرساند. پیش از دانلود، لحظهای به بررسی این گزینهها فکر کنید.
این کتاب رو در پلتفرم های دیگه ببینید
WorldCat به شما کمک میکنه تا کتاب ها رو در کتابخانه های سراسر دنیا پیدا کنید
امتیازها، نظرات تخصصی و صحبت ها درباره کتاب را در Goodreads ببینید
کتابهای کمیاب یا دست دوم را در AbeBooks پیدا کنید و بخرید
1141
بازدید4.5
امتیاز50
نظر98%
رضایتنظرات:
4.5
بر اساس 0 نظر کاربران
"کیفیت چاپ عالی بود، خیلی راضیام"
Questions & Answers
Ask questions about this book or help others by answering
No questions yet. Be the first to ask!


