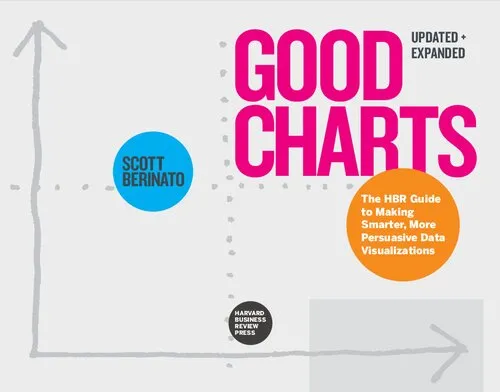
The Harvard Business Review Good Charts Collection: Tips, Tools, and Exercises for Creating Powerful Data Visualizations
4.5
بر اساس نظر کاربران

شما میتونید سوالاتتون در باره کتاب رو از هوش مصنوعیش بعد از ورود بپرسید
هر دانلود یا پرسش از هوش مصنوعی 2 امتیاز لازم دارد، برای بدست آوردن امتیاز رایگان، به صفحه ی راهنمای امتیازات سر بزنید و یک سری کار ارزشمند انجام بدینکتاب های مرتبط:
معرفی کتاب: The Harvard Business Review Good Charts Collection
کتاب «The Harvard Business Review Good Charts Collection: Tips, Tools, and Exercises for Creating Powerful Data Visualizations» یکی از برجستهترین کتابهای آموزش طراحی دادهنگاری (Data Visualization) در دنیای مدرن است. این اثر توسط اسکات بریناتو نوشته شده و هدف اصلی آن، آشنا کردن مخاطبان با اصول و مهارتهای ایجاد نمودارها و دادهنگاریهای تأثیرگذار و متقاعدکننده است. کتابی که به شما یاد میدهد چگونه معنا را از دادهها استخراج کنید و با انتقال مؤثر آنها، مخاطبان خود را تحت تأثیر قرار دهید.
خلاصهای از کتاب
این کتاب به طور خاص به نیازهای افرادی پاسخ میدهد که در زمینه ارائه دادهها و اطلاعات پیچیده فعالیت دارند، اما تجربه کمتری در طراحی نمودار دارند. بریناتو با ایجاد تعادل میان عناصر هنری و علمی دادهپردازی، گامی مهم در مسیر سادهسازی مفاهیم دادهمحور برداشته است. محتوای این کتاب شامل تکنیکهای کاربردی، توصیههای عملی، و تمرینهای هدفمند است که برای هر سطح از مهارت مناسب است. استفاده از مثالهای واقعی و نمودارهای قابل درک، این اثر را به مرجعی بیمانند در حوزه Data Visualization تبدیل کرده است.
نویسنده با تمرکز بر اصولی همچون وضوح (Clarity)، دقت (Precision)، و خلاقیت (Creativity)، سعی دارد تا خوانندگان را به خلق نمودارهایی قادر به برقراری ارتباط قوی و تأثیرگذاری عمیق هدایت کند.
نکات کلیدی از کتاب
- بررسی اصول اولیه Data Visualization و نحوه استفاده از ابزارهای آن.
- اهمیت داستانسرایی بصری (Visual Storytelling) در طراحی دادهها.
- تفاوت میان "نمودار خوب" و "نمودار بد" و تاثیر هرکدام بر مخاطب.
- چگونه نمودارها میتوانند تصمیمگیریهای تجاری را پشتیبانی کنند.
- نحوه استفاده از عناصر گرافیکی مانند رنگ، متن و ترتیب برای بهبود نمایش اطلاعات.
نقلقولهای معروف از کتاب
"A good chart is not just an end product, it’s an argument waiting to be made."
"Designing a chart means designing for understanding, not just aesthetics."
چرا این کتاب مهم است؟
در دنیای امروزی که دادهها به یکی از کلیدیترین داراییهای شرکتها و سازمانها تبدیل شدهاند، انتقال مؤثر این دادهها اهمیت بسیاری پیدا کرده است. یک نمودار خوب میتواند داستانی جذاب را روایت کند، مخاطبان را قانع کرده و روند تصمیمگیری را سرعت بخشد. اما تنها داشتن داده کافی نیست؛ هنر تبدیل داده به یک روایت معنیدار، نیاز به ابزارها و آموزشهای تخصصی دارد که این کتاب دقیقاً به همین موضوع میپردازد.
این کتاب به افراد کمک میکند تا اصول تفکر بصری را درک کرده و ابزارهای Data Visualization را به شکلی مؤثر به کار بگیرند. از مدیران تجاری گرفته تا تحلیلگران داده و حتی طراحان گرافیک، این کتاب میتواند به همه کسانی که با داده سر و کار دارند، ارزش بینظیری بیافزاید.
Introduction
Welcome to 'The Harvard Business Review Good Charts Collection: Tips, Tools, and Exercises for Creating Powerful Data Visualizations,' a masterfully crafted guide that takes readers through the art and science of effective visual storytelling with data. Drawing from the legacy of my work as an author and editor at the Harvard Business Review, this book compiles invaluable insights into how to conceptualize, create, and refine data visualizations that resonate with audiences and drive impactful decision-making.
In today’s data-driven world, presenting information clearly and persuasively is no longer optional—it's essential. This book is a practical and inspirational toolkit for anyone who desires to transform complex numbers and data into visual stories that not only inform but also inspire. Whether you are a seasoned data scientist, a business analyst, or someone who simply struggles with Excel charts, this book is designed to elevate your data visualization skills to a whole new level of competency and creativity. Let’s dive into the sections to better understand what this book has to offer and why it holds relevance across industries and professions.
Detailed Summary of the Book
The book is divided into actionable and thoughtfully designed chapters that cater to both beginners and advanced practitioners of data visualization.
We begin with a strong foundation on the principles of great charts. In the early chapters, we explore what makes a chart “good” and what makes one “bad." Concepts like clarity, simplicity, and context are fleshed out with real-world examples and exercises for practical application. You’ll learn how to assess your charts not just by their aesthetic appeal, but by their effectiveness in communicating ideas.
As the book progresses, it includes deeper discussions on choosing the right chart types, working with color and hierarchy, and understanding audience psychology. You will learn to see data visualization not just as a technical task, but as an artful means of storytelling. By blending analytical techniques with cognitive science principles, I demonstrate how to construct visuals that are both memorable and meaningful.
The latter sections are devoted to encouraging experimentation and iteration. Visualization is not just about following rules—it’s about breaking them strategically to create something unique and compelling. This is why the book incorporates exercises and examples from a variety of disciplines, allowing you to flex your creativity and move beyond generic bar graphs and pie charts.
At its core, this book is not just about teaching tools; it’s about cultivating a mindset where charts are seen as crucial instruments for problem-solving and storytelling in any domain.
Key Takeaways
- Understand the key characteristics of effective data visualizations: clarity, accuracy, and meaningfulness.
- Learn how to think visually and identify the best ways to present data to different audiences.
- Develop the ability to critique and revise your charts to maximize their impact.
- Master techniques for choosing chart types, colors, and graphical elements strategically.
- Discover how to combine analytical rigor with creative flair to tell compelling stories with data.
- Practice with hands-on exercises that challenge your understanding and push your boundaries.
Famous Quotes from the Book
"A chart isn't just a picture of data; it's a story waiting to be told, and the storyteller is you."
"Clutter is the enemy of clarity. Start by subtracting everything that doesn’t add meaning to your message."
"Good charts don’t just display numbers—they evoke understanding, curiosity, and action."
Why This Book Matters
In an age where vast amounts of data are generated daily, the ability to communicate that data effectively is more critical than ever. Whether you are a business leader advocating for strategic changes, a researcher sharing groundbreaking discoveries, or a consultant delivering insights to a client, how you present your data can make or break your message.
This book matters because it demystifies the complexity of data visualization and empowers readers to take their communication skills to the next level. By bridging the gap between visual design and analytics, this book helps individuals and organizations unlock the full potential of their data. With its mix of strategy, design, and psychology, the lessons here transcend industries, making it a resource that remains relevant no matter the context.
Ultimately, this book is not about creating pretty charts; it is about creating purposeful ones. It is a call to use data visualization as a tool for clarity, persuasion, and connection in a chaotic, information-saturated world.
دانلود رایگان مستقیم
شما میتونید سوالاتتون در باره کتاب رو از هوش مصنوعیش بعد از ورود بپرسید
دسترسی به کتابها از طریق پلتفرمهای قانونی و کتابخانههای عمومی نه تنها از حقوق نویسندگان و ناشران حمایت میکند، بلکه به پایداری فرهنگ کتابخوانی نیز کمک میرساند. پیش از دانلود، لحظهای به بررسی این گزینهها فکر کنید.
این کتاب رو در پلتفرم های دیگه ببینید
WorldCat به شما کمک میکنه تا کتاب ها رو در کتابخانه های سراسر دنیا پیدا کنید
امتیازها، نظرات تخصصی و صحبت ها درباره کتاب را در Goodreads ببینید
کتابهای کمیاب یا دست دوم را در AbeBooks پیدا کنید و بخرید
1362
بازدید4.5
امتیاز0
نظر98%
رضایتنظرات:
4.5
بر اساس 0 نظر کاربران
Questions & Answers
Ask questions about this book or help others by answering
No questions yet. Be the first to ask!


