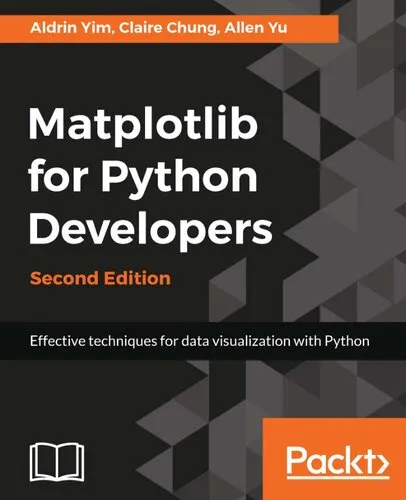
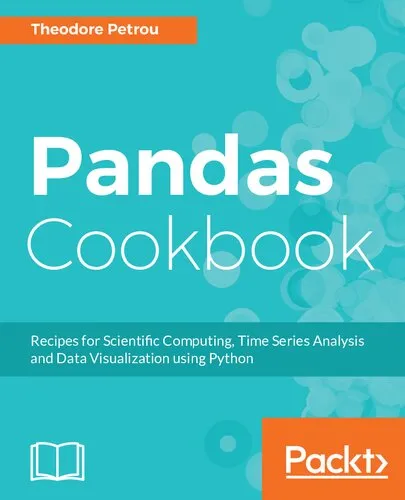
MATPLOTLIB FOR PYTHON DEVELOPERS - : effective techniques for data visualization with python.
5.0
بر اساس نظر کاربران

شما میتونید سوالاتتون در باره کتاب رو از هوش مصنوعیش بعد از ورود بپرسید
هر دانلود یا پرسش از هوش مصنوعی 2 امتیاز لازم دارد، برای بدست آوردن امتیاز رایگان، به صفحه ی راهنمای امتیازات سر بزنید و یک سری کار ارزشمند انجام بدینکتاب های مرتبط:
معرفی کتاب "MATPLOTLIB FOR PYTHON DEVELOPERS - : تکنیکهای مؤثر برای بصریسازی دادهها با پایتون"
خلاصه کتاب
"MATPLOTLIB FOR PYTHON DEVELOPERS" با هدف تبدیلکنندگان دادهها به انجام عملیاتهای پیچیدهتر با دادههای خود طراحی شده است. این کتاب با پوشش گسترده ای از مباحث، شما را از مراحل ابتدایی تا موضوعات پیشرفته تر در زمینه تجسم دادهها با Matplotlib همراهی میکند.
از طریق مجموعهای از مثالهای واقعی، این کتاب نشان میدهد که چطور میتوانید از Matplotlib برای ایجاد نمودارهای تعاملی، تخصیص رنگهای سفارشی، و حتی ساخت انیمیشنها و تصاویر گرافیکی زیبا استفاده کنید. این رویکرد گام به گام، شما را قادر میسازد تا به سرعت با ویژگیها و عملکردهای مختلف این کتابخانه آشنا شوید.
نکات کلیدی
- آشنایی کامل با Matplotlib و نحوه استفاده از آن برای تجسم دادههای پیچیده
- ایجاد و سفارشیسازی نمودارهای متفاوت
- کار با ویژگیهای پیشرفته همچون انیمیشنسازی دادهها و ایجاد نمودارهای تعاملی
- مهارتهای کدنویسی تمیز و بهینه در پایتون به کمک Matplotlib
نقلقولهای معروف از کتاب
تعدادی از نقلقولهای معروف از کتاب شامل موارد زیر است:
"تجسم دادهها نه تنها یک هنر، بلکه علمی است که نیازمند دانش دقیق و تکنیکی است."
"Matplotlib ابزاری است که دنیای دادهها را به شکل ظاهری جذاب نشان میدهد و بینشهای عمیقتری از اطلاعات پنهان فراهم میکند."
چرا این کتاب مهم است؟
این کتاب به عنوان یک منبع اصلی برای کسانی که به دنبال کسب مهارتهای عمیقتر در بصریسازی دادهها هستند، اهمیت دارد. با استفاده از رویکردهای کاربردی و تکنیکهای پیشرفتهای که در این کتاب ارائه شده است، توسعهدهندگان میتوانند دادهها را به شکلی معنیدار و اثرگذار به نمایش بگذارند.
Matplotlib یکی از مهمترین ابزارهایی است که هر برنامهنویس پایتون باید بر آن تسلط داشته باشد تا بتواند در دنیای امروز، که دادهها نقش بسیار مهمی در تصمیمگیری دارند، به طور مؤثر عمل کند.
Welcome to 'Matplotlib for Python Developers: Effective Techniques for Data Visualization with Python' - your comprehensive guide to mastering data visualization with Python's most popular plotting library.
Detailed Summary of the Book
Data visualization has become an indispensable tool in the era of big data and machine learning, and Matplotlib stands out as a robust option for Python developers seeking to effectively present and communicate data insights. This book is meticulously crafted to cater to developers ranging from novices taking their first steps in data visualization to experienced professionals aiming to refine their skills to a higher level.
Throughout the book, you will be introduced to Matplotlib starting with installation tips and basic plotting. As you advance, you will encounter more complex plot types, custom styling, and practical applications. Emphasis is placed on real-world scenarios and the integration of Matplotlib with libraries like Pandas and NumPy to manipulate and visualize data effortlessly.
Key concepts such as customizing ticks, handling figure aesthetics, and leveraging 3D plotting capabilities are illustrated with detailed examples. By the end of this book, you will possess the acumen to create detailed, informative, and aesthetically pleasing plots easily and intuitively.
Key Takeaways
This book offers numerous insights and practical tricks:
- Understand the basics: Navigate Matplotlib's core functionalities from the ground up.
- Advance techniques: Explore plotting complex data, including time series, and geographical projections.
- Customize plots: Learn how to tailor maps with legends, color codes, and interactive features.
- Workflow optimizations: Detect and troubleshoot common issues to streamline your visualization process.
- Integration: Utilize Matplotlib alongside other libraries such as Pandas and NumPy to facilitate comprehensive data analysis.
Famous Quotes from the Book
"Data visualization is the language we use to communicate across many disciplines. Master it, and you will empower not just your data, but your capability to convey its story coherently."
"In an ocean of information, a well-crafted visualization is the lighthouse that guides the observer to safety—clarity through storms of complexity."
Why This Book Matters
In a world increasingly driven by data, the capacity to visualize complex data arrays concisely and clearly is often the differentiator that elevates a developer's insights. Mastering Matplotlib is not merely about creating graphs; it's about harnessing a powerful tool that, when used adeptly, has the potential to transform raw data into stories that inform and convince.
This book bridges the gap between technical mastery and creative expression. Developers who understand how to manipulate both data and its visualization will find themselves with a considerable advantage in nearly any field of work. This text serves not only as a practical guide but as an inspiration to explore and harness the potential of your datasets through advanced visualization techniques.
By focusing on Matplotlib’s flexibility and adaptability, we ensure that your visualization toolkit is as expansive as your imagination, equipping you with the skills and confidence to tackle any data-driven challenge with clarity and impact.
دانلود رایگان مستقیم
شما میتونید سوالاتتون در باره کتاب رو از هوش مصنوعیش بعد از ورود بپرسید
دسترسی به کتابها از طریق پلتفرمهای قانونی و کتابخانههای عمومی نه تنها از حقوق نویسندگان و ناشران حمایت میکند، بلکه به پایداری فرهنگ کتابخوانی نیز کمک میرساند. پیش از دانلود، لحظهای به بررسی این گزینهها فکر کنید.
این کتاب رو در پلتفرم های دیگه ببینید
WorldCat به شما کمک میکنه تا کتاب ها رو در کتابخانه های سراسر دنیا پیدا کنید
امتیازها، نظرات تخصصی و صحبت ها درباره کتاب را در Goodreads ببینید
کتابهای کمیاب یا دست دوم را در AbeBooks پیدا کنید و بخرید
1494
بازدید5.0
امتیاز1
نظر98%
رضایتنظرات:
5.0
بر اساس 1 نظر کاربران
the_melting
30 ژون 2025، ساعت 9:52
I thought this book will be color printed but this book is not color printed.
Questions & Answers
Ask questions about this book or help others by answering
No questions yet. Be the first to ask!
