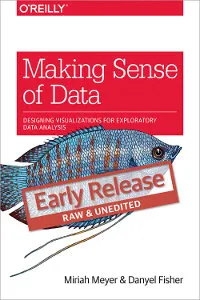
Making Sense of Data: Designing Effective Visualizations
4.4
بر اساس نظر کاربران

شما میتونید سوالاتتون در باره کتاب رو از هوش مصنوعیش بعد از ورود بپرسید
هر دانلود یا پرسش از هوش مصنوعی 2 امتیاز لازم دارد، برای بدست آوردن امتیاز رایگان، به صفحه ی راهنمای امتیازات سر بزنید و یک سری کار ارزشمند انجام بدینکتاب های مرتبط:
معرفی کتاب: درک دادهها: طراحی نمایشهای مؤثر
کتاب «درک دادهها: طراحی نمایشهای مؤثر» اثر ماریه مایر و دنیل فیشر، یک راهنمای جامع و عملی برای طراحی visualizationهای مؤثر است که به خوانندگان کمک میکند تا دادهها را به شکلی قابل فهم و جذاب نمایش دهند.
خلاصهای از کتاب
این کتاب به بررسی اصول و تکنیکهای کلیدی میپردازد که طراحی visualizationهای مؤثر را تسهیل میکنند. نویسندگان با استفاده از مثالهای واقعی و مطالعههای موردی، اهمیت طراحی هنری در فرآیند تحلیل دادهها را تشریح میکنند. از طراحی ساده نمودارهای line chart تا رفتارهای پیچیده در دادههای چندبعدی، این کتاب تمامی جنبهها را پوشش میدهد.
نویسندگان همچنین بر اهمیت تعامل انسان و داده تأکید کرده و راهبردهایی برای بهرهبرداری بهینه از ابزارهای visualization ارائه مینمایند. آنها خواننده را تشویق میکنند تا با تفکر طراحی به دادهها نزدیک شده و تصمیمگیریهای دادهمحور متفکرانهتری انجام دهند.
نکات کلیدی
- تأکید بر نقش حیاتی طراحی در تفسیر دادهها و تصمیمگیریهای استراتژیک
- استفاده از interactive tools برای افزایش فهم و درک بهتر دادهها
- ارائه تمرینها و فعالیتهای عملی برای تقویت مهارتهای طراحی visualization
- بررسی چالشهای اخلاقی و مسئولیتهای اجتماعی در طراحی و استفاده از visualization
جملات معروف از کتاب
"Visualization به عنوان یک زبان بصری، نقش کلیدی در تحلیل دادهها و برقراری ارتباط بین انسان و ماشین ایفا میکند."
"طراحی خوب، به معنی انتقال شفاف و قاطعانه اطلاعات با کمترین ابهام ممکن است."
چرا این کتاب مهم است؟
در عصر داده، ability to interpret و رابطه داشتن با حجم وسیعی از اطلاعات، مهارتی حیاتی برای بسیاری از حرفهها میباشد. این کتاب نه تنها برای طراحان و علم دادهکاران، بلکه برای هر کسی که به دنبال بهبود تواناییهای خود در زمینه visualization است، یک منبع ارزشمند محسوب میشود. تأکید کتاب بر اصول ماندگار طراحی و تعامل باعث میشود که اطلاعات به شیوهای قابل دسترستر و تأثیرگذارتر ارائه شوند.
Introduction
Welcome to the world of visual storytelling and data interpretation with Making Sense of Data: Designing Effective Visualizations. Authored by Miriah Meyer and Danyel Fisher, this book serves as both a comprehensive guide and an inspiring resource for anyone interested in the science and art of data visualization. Set against the backdrop of a world deluged with data, our aim is to equip readers with the knowledge and skills necessary to transform raw data into compelling visual narratives.
Detailed Summary of the Book
In this book, Meyer and Fisher tap into years of academic and industry experience to present a vivid exploration of how data visualizations are conceived, crafted, and consumed. The book begins by laying a foundational understanding of data types, characteristics, and the various challenges associated with raw data. Moving beyond theory, it transports readers into the design phase, where principles of aesthetics and functionality converge to produce visualizations that not only inform but also engage.
The narrative of the book is built around practical examples and case studies from a variety of disciplines, illustrating how effective visualizations have been utilized to provide insights and foster understanding. By blending high-level concepts with in-depth technical tips, the authors emphasize a hands-on approach, encouraging readers to actively participate in the visualization process.
Key Takeaways
- Understanding the principles of visual perception and how they influence design choices.
- Exploring different types of data visualizations and when to use them effectively.
- Learning the importance of context and narrative in designing visualizations that tell a story.
- Strategies for overcoming common visualization challenges and pitfalls.
- Insight into the role of interaction in modern visualizations.
Famous Quotes from the Book
“Good data visualization is a story told with data, not just pretty pictures."
“The best visualizations allow users to see the forest and the trees, highlighting key data points while providing the broader context."
Why This Book Matters
Making Sense of Data: Designing Effective Visualizations is more than just a guide; it is a manifesto for the forthcoming era where visual data interpretation becomes central to decision-making processes across industries. As organizations continue to pivot towards data-driven strategies, the ability to visualize data effectively is becoming a critical skill. This book fills the knowledge gap, providing readers with the tools needed to decipher and convey the complex stories hidden within datasets.
Crucially, the book also addresses the ethical responsibilities that come with handling data, ensuring visualizations are not only accurate but also truthful. For students, practitioners, and anyone eager to harness the power of data, this book is a beacon that illuminates the path to mastering the craft of visualization.
Embark on this enlightening journey and discover how to use the art of visualization to transform data into insights, learning how to not just see data, but understand it in its full potential and context.
دانلود رایگان مستقیم
شما میتونید سوالاتتون در باره کتاب رو از هوش مصنوعیش بعد از ورود بپرسید
دسترسی به کتابها از طریق پلتفرمهای قانونی و کتابخانههای عمومی نه تنها از حقوق نویسندگان و ناشران حمایت میکند، بلکه به پایداری فرهنگ کتابخوانی نیز کمک میرساند. پیش از دانلود، لحظهای به بررسی این گزینهها فکر کنید.
این کتاب رو در پلتفرم های دیگه ببینید
WorldCat به شما کمک میکنه تا کتاب ها رو در کتابخانه های سراسر دنیا پیدا کنید
امتیازها، نظرات تخصصی و صحبت ها درباره کتاب را در Goodreads ببینید
کتابهای کمیاب یا دست دوم را در AbeBooks پیدا کنید و بخرید
1291
بازدید4.4
امتیاز0
نظر98%
رضایتنظرات:
4.4
بر اساس 0 نظر کاربران
Questions & Answers
Ask questions about this book or help others by answering
No questions yet. Be the first to ask!



![Good Charts, Updated and Expanded: The HBR Guide to Making Smarter, More Persuasive Data Visualizations [Team-IRA]](https://s3.refhub.ir/images/thumb/Good_Charts__Updated_and_Expanded__The_HBR_Gu_31517.webp)
