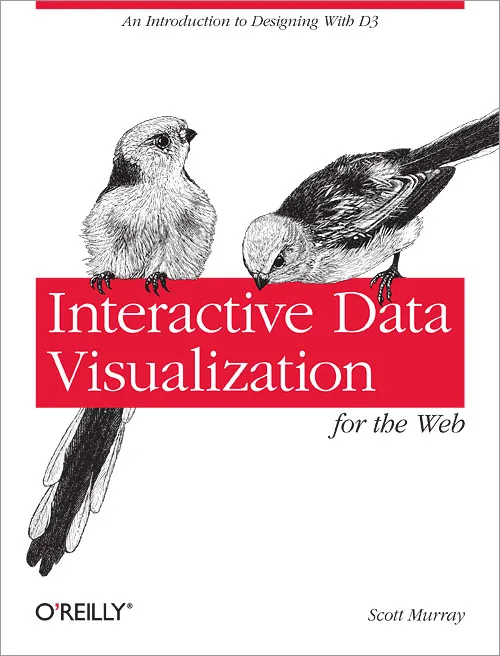
Interactive Data Visualization for the Web: An Introduction to Designing with D3
4.5
بر اساس نظر کاربران

شما میتونید سوالاتتون در باره کتاب رو از هوش مصنوعیش بعد از ورود بپرسید
هر دانلود یا پرسش از هوش مصنوعی 2 امتیاز لازم دارد، برای بدست آوردن امتیاز رایگان، به صفحه ی راهنمای امتیازات سر بزنید و یک سری کار ارزشمند انجام بدینکتاب های مرتبط:
معرفی کتاب
کتاب Interactive Data Visualization for the Web: An Introduction to Designing with D3 نوشته اسکات موری، یک راهنمای جامع برای افرادی است که میخواهند دنیای هیجانانگیز بصریسازی دادهها در وب را با استفاده از D3.js کشف کنند. این کتاب به تمرکز بر طراحی بصری دادهها از طریق این کتابخانه جاوا اسکریپت قدرتمند پرداخته و به خوانندگان کمک میکند تا مهارتهای لازم برای ایجاد گرافیکهای پویا و تعاملی را پیدا کنند.
خلاصهای از کتاب
کتاب با ارائه یک مرور مقدماتی از مفاهیم پایه دادهها و اهمیت بصریسازی آنها آغاز میشود. سپس، به طور خاص به کار با کتابخانه D3.js میپردازد که به عنوان ابزاری برای تبدیل دادههای خام به گرافیکهای زیبا و توانا بکار میرود. نویسنده مفاهیم اولیه D3 مانند انتخابها، دادهبندیها، و تغییرات بصری را به شیوهای ساده توضیح میدهد. فرآیند ساخت گرافیکها به صورت مرحلهبهمرحله توضیح داده میشود و هرکدام از مباحث با مثالهای عملی همراه است تا امکان درک سریعتری برای خواننده فراهم آید. در نهایت، کتاب به مبحث پیشرفتهتری مثل انیمیشنها و تعاملات پیچیدهتر میپردازد.
نکات کلیدی
- درک اصول پایه D3.js و چگونگی اعمال آن بر روی دادهها
- بررسی ساختار Selectionها و استفاده از Data Binding در D3.js
- یادگیری مفاهیم مختلف برای ایجاد، به روزرسانی و حذف عناصر در DOM
- آشنایی با ترنزیشنها و انیمیشنها برای ارتقای تجربه کاربری گرافیک
- یادگیری طراحیهای پویا براساس دادههای واقعی و استفاده از تعاملات تعاملی
اعتبار کتاب
این کتاب بهویژه برای توسعهدهندگانی که قصد دارند کار با دادهها را بیاموزند اهمیت دارد. داشتن توانایی تجسم دادهها نهتنها باعث افزایش دید کاربران به اطلاعات میشود، بلکه امکان تجزیه و تحلیل سریع و کارآمدتر را نیز فراهم میکند. توانایی استفاده از ابزارهای قدرتمندی مانند D3.js در دنیای دیجیتالی امروز فرصتی بینظیر برای هر توسعهدهنده است تا ارزش بیشتری به پروژههای خود اضافه کند.
چرا این کتاب مهم است؟
اهمیت این کتاب نه تنها در ارائه یک راهنمای کامل و گامبهگام برای یادگیری D3.js است، بلکه در سبک آموزشی منحصر به فرد نویسنده نیز نهفته است. اسکات موری با بهرهگیری از تجربه تدریس و دانش گسترده خود، توانسته است به گونهای مطالب را تنظیم کند که برای هر خوانندهای از مبتدی تا پیشرفته قابل استفاده باشد. همچنین، رویکرد عملی کتاب باعث میشود تا خوانندگان بتوانند آموختههای خود را به سرعت در پروژههای واقعی به کار گیرند و مهارتهای خود را تقویت کنند.
"بصریسازی دادهها نه تنها درباره نمایش اطلاعات است، بلکه بیشتر درباره تغییر نحوه تفکر ما نسبت به آنها است."
Introduction to Interactive Data Visualization for the Web: An Introduction to Designing with D3
Welcome to an era where data speaks to us through interactive graphics, and where the human eye and mind can engage with complex datasets in intuitive ways. "Interactive Data Visualization for the Web: An Introduction to Designing with D3" serves as a key resource for those interested in transforming raw numbers into compelling visual stories.
Detailed Summary of the Book
In this comprehensive guide, you'll embark on a journey into the world of data visualization, specifically focusing on the D3.js JavaScript library—a tool that redefines how we present data on the web. The book is crafted to guide readers from basic concepts to advanced techniques, enabling non-programmers and seasoned developers alike to create rich, interactive, and animated visualizations.
Beginning with an introduction to the foundations of data visualization, the book delves into a step-by-step tutorial format. You'll learn how to set up your work environment, understand the core principles of using D3.js, and progressively build up your skills to create sophisticated graphics. Detailed examples and practical exercises accompany each chapter, reinforcing the knowledge and inspiring creativity.
Alongside technical skills, the book emphasizes the art of storytelling with data. It stresses the importance of aesthetics and usability, ensuring that your visualizations not only convey information but also engage and resonate with your audience.
Key Takeaways
- Understanding of D3.js fundamentals and its capabilities in data visualization.
- Knowledge of web technologies including HTML, CSS, and JavaScript, essential for creating web-based visualizations.
- Step-by-step guidance on building your first interactive data visualization projects.
- Insights into design principles that enhance the storytelling aspect of your visualizations.
- Hands-on exercises to practice skills and deepen understanding.
Famous Quotes from the Book
"Data is the new soil."
"The purpose of visualization is insight, not pictures."
Why This Book Matters
In today's data-driven world, the ability to transform data into meaningful visual narratives is a sought-after skill. "Interactive Data Visualization for the Web" is not just a technical manual; it's a gateway to understanding and communicating complex data. As businesses and researchers increasingly rely on data to make decisions, the demand for professionals who can tell stories through data visualization continues to grow.
By aligning technical proficiency with design aesthetics, this book bridges the gap between data science and art, equipping you with the tools needed to convey your data-driven insights effectively. Whether you're a data analyst, designer, or developer, the skills you gain will empower you to create visualizations that not only inform but also captivate your audience.
دانلود رایگان مستقیم
شما میتونید سوالاتتون در باره کتاب رو از هوش مصنوعیش بعد از ورود بپرسید
دسترسی به کتابها از طریق پلتفرمهای قانونی و کتابخانههای عمومی نه تنها از حقوق نویسندگان و ناشران حمایت میکند، بلکه به پایداری فرهنگ کتابخوانی نیز کمک میرساند. پیش از دانلود، لحظهای به بررسی این گزینهها فکر کنید.
این کتاب رو در پلتفرم های دیگه ببینید
WorldCat به شما کمک میکنه تا کتاب ها رو در کتابخانه های سراسر دنیا پیدا کنید
امتیازها، نظرات تخصصی و صحبت ها درباره کتاب را در Goodreads ببینید
کتابهای کمیاب یا دست دوم را در AbeBooks پیدا کنید و بخرید
1410
بازدید4.5
امتیاز0
نظر98%
رضایتنظرات:
4.5
بر اساس 0 نظر کاربران
Questions & Answers
Ask questions about this book or help others by answering
No questions yet. Be the first to ask!


