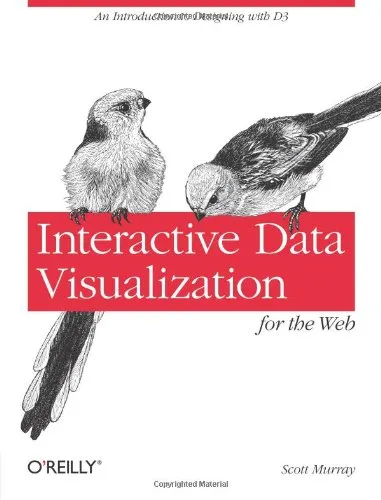
Interactive Data Visualization for the Web
4.3
بر اساس نظر کاربران

شما میتونید سوالاتتون در باره کتاب رو از هوش مصنوعیش بعد از ورود بپرسید
هر دانلود یا پرسش از هوش مصنوعی 2 امتیاز لازم دارد، برای بدست آوردن امتیاز رایگان، به صفحه ی راهنمای امتیازات سر بزنید و یک سری کار ارزشمند انجام بدینکتاب های مرتبط:
معرفی کتاب "Interactive Data Visualization for the Web"
کتاب "Interactive Data Visualization for the Web" نوشته اسکات موری، یکی از جامعترین و ابتداییترین منابع برای یادگیری مصورسازی دادهها به صورت تعاملی بر بستر وب است. این کتاب به صورت قدم به قدم و با تمرکز بر اصول پایهای JavaScript، HTML و CSS، همچنین استفاده از D3.js، محبوبترین کتابخانه برای مصورسازی دادهها، به شما کمک میکند تا از دادههای خود به طریقی جذاب و معنادار استفاده کنید.
خلاصهای جامع از کتاب
این کتاب ابتدا با توضیح مفاهیم بنیادی وب و ساختار دادهها آغاز میشود. موری با اشاره به نحوه بارگذاری و آمادهسازی دادهها، شما را با ابتداییترین مراحل کار مصورسازی آشنا میکند. سپس قدم به مراحل پیشرفتهتر مانند ایجاد طرحهای بصری تعاملی با استفاده از D3.js میگذارید. این ابزار قدرتمند به شما اجازه میدهد تا دادههای خود را به تصاویر زیبا و کاربردی تبدیل کنید.
یکی از نکات برجسته این کتاب، تمرکز بر آموزش بصری مفاهیم پیچیده است. با ارائه مثالهای عملی، شما را به چالش کشیده و تشویق به استفاده خلاقانه از ابزارهای مصورسازی میکند. اسکات موری به همراه کدهای نمونه و توضیحات مفصل، شما را در هر گام از فرآیند راهنمایی میکند.
نکات کلیدی کتاب
- فهم عمیق از مفاهیم پایهای HTML, CSS و JavaScript و ارتباط این تکنولوژیها در طراحی وب.
- آشنایی جامع با D3.js و یادگیری نحوه پیادهسازی آن در پروژههای واقعی.
- آموزش نحوه دسترسی و استفاده از دادههای مختلف و تبدیل آن به اشکال گرافیکی معنادار.
- ارائه روشهای مختلف برای بهبود تجربه کاربری با ایجاد تعامل در مصورسازی دادهها.
جملات معروف از کتاب
مصورسازی دادهها تنها به معنای ایجاد تصاویری زیبا نیست، بلکه خلق داستانی است که هر دادهای را به زبان بصری قابل فهم تبدیل میکند.
D3.js ابزاری است برای آرزوهای بزرگ؛ شما را قادر میسازد که چیزی فراتر از آنچه تاکنون دیده شده بسازید.
چرا این کتاب اهمیت دارد؟
باتوجه به رشد سریع دادهها در دنیای دیجیتال امروز، توانایی مصورسازی دادهها به صورت تعاملی و جذاب از اهمیت ویژهای برخوردار است. کتاب "Interactive Data Visualization for the Web" بگونهای طراحی شده است که هم مبتدیان و هم حرفهایها بتوانند از آن به عنوان منبعی معتبر و کارآمد استفاده کنند.
این کتاب با ترکیب اصولی نوآوری و خلاقیت به همراه تکنیکهای برنامهنویسی، به شما یاد میدهد که چگونه دادهها را به آثاری هنری و کاربردی تبدیل کنید. همچنین با تمرکز بر استفاده عملی از D3.js، این کتاب به شما ابزارهای لازم برای بروز خلاقیت و ساخت مصورسازیهای تعاملی را میدهد.
همچنین، اشارات واضح و کاربردی به مفاهیم پیچیده به خوانندگان این امکان را میدهد که درک عمیقی از فرآیند مصورسازی دادهها بیابند و بتوانند این مفاهیم را به پروژههای خود اعمال کنند.
Introduction to Interactive Data Visualization for the Web
Welcome to an exciting journey into the world of data visualization with D3.js! "Interactive Data Visualization for the Web" is your essential guide to creating dynamic, data-driven visual representations on the web. Written by Scott Murray, this book serves as both an introductory guide and an in-depth resource for web developers, data analysts, and anyone interested in crafting interactive visualizations.
Detailed Summary of the Book
The book begins by demystifying the complexities of D3.js, a JavaScript library that has become the industry standard for producing web-based data visuals. Through detailed explanations and practical examples, the author, Scott Murray, guides you from the basics of setting up your development environment and understanding how data can be structured to more advanced topics like creating sophisticated visualizations.
This hands-on approach ensures that you gain not only theoretical knowledge but also practical skills. You'll learn to create a wide range of visualizations, including bar charts, scatter plots, and interactive maps. The book delves deeply into each aspect of D3, from manipulating the Document Object Model (DOM) to handling data updates in real-time. By the end, you will be well-equipped to tackle complex data visualization projects independently.
Key Takeaways
By reading "Interactive Data Visualization for the Web," you will:
- Understand the core principles and capabilities of D3.js.
- Learn to transform data into engaging visual narratives.
- Grasp the concepts of scales, axes, and layouts to build structured visualizations.
- Develop skills to handle real-world data sets effectively and dynamically.
- Enhance your ability to create responsive and interactive user interfaces.
Famous Quotes from the Book
Here are some thought-provoking quotes from the book that encapsulate Scott Murray’s vision:
"Data visualization is not just a tool to make information prettier but a fundamental means to understanding and insight."
"The power of D3.js lies not in the library itself, but in the imagination of the developer using it."
Why This Book Matters
In today's data-driven world, the ability to visualize data effectively is more crucial than ever. "Interactive Data Visualization for the Web" addresses this need by empowering developers and analysts to build tools that reveal insights and tell compelling stories through data. Scott Murray's clear, concise, and approachable style makes the daunting challenge of learning a new programming library approachable and engaging.
This book is particularly relevant for IT professionals, data scientists, digital artists, and educators, providing them with the ability to refine their skills and adapt to an ever-evolving digital landscape. Furthermore, the emphasis on interactive elements within web pages makes it an invaluable resource for creating modern, user-centric applications.
دانلود رایگان مستقیم
شما میتونید سوالاتتون در باره کتاب رو از هوش مصنوعیش بعد از ورود بپرسید
دسترسی به کتابها از طریق پلتفرمهای قانونی و کتابخانههای عمومی نه تنها از حقوق نویسندگان و ناشران حمایت میکند، بلکه به پایداری فرهنگ کتابخوانی نیز کمک میرساند. پیش از دانلود، لحظهای به بررسی این گزینهها فکر کنید.
این کتاب رو در پلتفرم های دیگه ببینید
WorldCat به شما کمک میکنه تا کتاب ها رو در کتابخانه های سراسر دنیا پیدا کنید
امتیازها، نظرات تخصصی و صحبت ها درباره کتاب را در Goodreads ببینید
کتابهای کمیاب یا دست دوم را در AbeBooks پیدا کنید و بخرید
1515
بازدید4.3
امتیاز0
نظر98%
رضایتنظرات:
4.3
بر اساس 0 نظر کاربران
Questions & Answers
Ask questions about this book or help others by answering
No questions yet. Be the first to ask!


