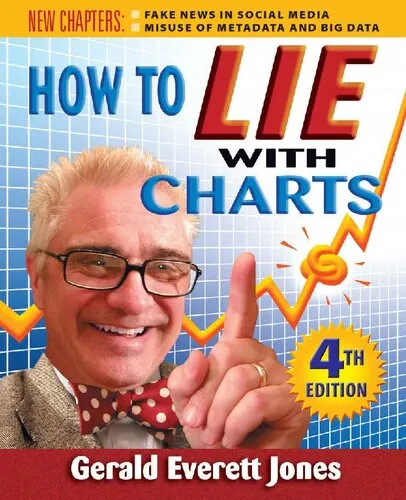
How to Lie with Charts
4.0
بر اساس نظر کاربران

شما میتونید سوالاتتون در باره کتاب رو از هوش مصنوعیش بعد از ورود بپرسید
هر دانلود یا پرسش از هوش مصنوعی 2 امتیاز لازم دارد، برای بدست آوردن امتیاز رایگان، به صفحه ی راهنمای امتیازات سر بزنید و یک سری کار ارزشمند انجام بدینکتاب های مرتبط:
معرفی کامل کتاب "How to Lie with Charts"
کتاب "How to Lie with Charts" تألیف جرالد اورت جونز یک منبع فوقالعاده و جامع برای درک بهتر استفاده و تفسیر صحیح از نمودارها است. این کتاب بیشتر به چگونگی فریبکاریهای احتمالی با استفاده از دادهها و چارتها در ارائهها و گزارشها میپردازد و ابزارهایی ارائه میدهد تا بتوانید این اشتباهات عمدی یا سهوی را شناسایی کنید. این مطلب به ویژه برای کارشناسان داده، مدیران، تحلیلگران و تمامی کسانی که با تصمیمگیریهای مبتنی بر داده سروکار دارند، بسیار کلیدی است.
خلاصه جامع کتاب
این کتاب در چندین فصل جداگانه به تشریح اصول استفاده از Charts میپردازد و نشان میدهد که چگونه میتوان از آنها برای ایجاد ارتباط روشن یا برای گمراه کردن مخاطبان استفاده کرد. نویسنده با زبانی ساده و طنزآمیز به بررسی راههایی میپردازد که میتوان با ویرایش دادهها، تغییر در مقیاسهای نمودار یا استفاده انتخابی از اطلاعات، موجب سوءتفاهم و برداشت اشتباه شد.
عنوانهای اصلی کتاب شامل موضوعاتی همچون نحوه مقیاسبندی اطلاعات، دستکاری در رنگها، استفاده نادرست از نمودارها و چگونگی طراحی صحیح برای انتقال پیام است. کتاب نه تنها راههای تشخیص این نوع فریبها را آموزش میدهد، بلکه نشان میدهد که چگونه میتوان در طراحی گزارشهای خود از این اشتباهها جلوگیری کرد.
نکات کلیدی کتاب
- تفاوت بین دادههای خام و دادههای نمایش دادهشده در Charts.
- فواید و مضرات استفاده از رنگها، فونتها و اندازهها در طراحی نمودارها.
- نحوه تشخیص مقیاسهای گمراهکننده در نمودارهای خطی و ستونی.
- چگونه ارائهدهندگان از حذف دادهها یا تغییر مقادیر برای گمراه کردن مخاطب استفاده میکنند.
- تأکید بر ارائه صادقانه اطلاعات و اهمیت اخلاق در طراحی بصری.
نقلقولهای معروف از کتاب
- "Numbers don't lie, but how you present them can be artfully deceptive."
- "A chart can either elucidate or obscure, depending entirely on the designer’s intent."
- "When the scale lies, the message becomes a fiction."
- "Every chart is a choice—every choice is a bias."
چرا این کتاب مهم است؟
کتاب "How to Lie with Charts" یکی از منابع ضروری برای هر کسی است که در تحلیل دادهها و طراحی بصری اطلاعات فعالیت میکند. فهمیدن چگونگی خواندن و طراحی نمودارها نه تنها به ارائه پیامهای قویتر کمک میکند، بلکه از اشتباهات یا فریبهای عمدی جلوگیری میکند. این کتاب کمک میکند که در جهانی پر از داده و اطلاعات، مخاطب خود را به درستی درک کنید و از گمراه شدن در مواجهه با دیتاهای پیچیده جلوگیری کنید.
با رشد روزافزون استفاده از مصورسازیهای داده در تمامی صنایع، یادگیری نحوه کار با آنها و تشخیص ترفندهای احتمالی، به یک مهارت حیاتی تبدیل شده است. مطالعه این کتاب شما را مجهز به اصول و رهنمودهایی میکند که میتواند در حرفه شما تاثیر عمدهای بگذارد.
Introduction to "How to Lie with Charts"
"How to Lie with Charts" by Gerald Everett Jones is an insightful and fascinating deep dive into the often-overlooked world of data visualization. Whether you're a professional in business, marketing, or data science—or simply an intrigued spectator—this book will reshape the way you interpret visual information. It masterfully exposes how graphs, charts, and other graphical representations of data can be manipulated to mislead, distort, or subtly influence perspectives. At the same time, it equips you with the skills to discern credible visuals from manipulative ones, ensuring that you're not duped by even the most deceptive charts.
In an era dominated by data-driven decision-making and visualization, more and more individuals rely on charts to communicate complex information quickly and effectively. However, the power of charts can be both a blessing and a curse. On one hand, they serve as a simplified lens to understand large sets of data; on the other, they have the potential to misinform or propagate biased narratives. Gerald Everett Jones meticulously unpacks these dynamics in this engaging and practical guide.
This book's purpose transcends simply labeling graphical manipulation as "bad" or "misleading." It's a call for heightened awareness, teaching you how to critically assess visual presentations and identify whether the storyteller behind the data is being truthful—or cleverly orchestrating a well-disguised lie. You'll learn essential techniques not only for spotting deceit in charts but also for using visualization responsibly if you're the one presenting the data.
Detailed Summary of the Book
The book begins by outlining the fundamental principles of graphical communication and why visuals are so powerful in shaping perceptions. From there, it dives into specific tactics that are commonly used to manipulate data through charts. These include cherry-picking data, tweaking scales, utilizing misleading visuals, and manipulating the "story" told by the visualization. You'll receive step-by-step explanations of how such methods can distort the truth, along with real-world examples that illustrate each point vividly.
Moving forward, "How to Lie with Charts" doesn't leave you hanging in a sea of skepticism. It provides tools and frameworks for becoming a critical and discerning consumer of data. The book emphasizes how to read between the lines of what a graph or chart is really saying while considering context, sourcing, and intent. It also highlights best practices for creating truthful and reliable visuals to communicate effectively without compromising ethical principles.
Overall, this book acts as a guidebook for anyone who interacts with data visualization, whether consuming it or creating it. It's equal parts informative and practical, making it an invaluable resource for navigating today's data-driven world.
Key Takeaways
- Charts and visuals are powerful tools for communication, but they can easily be manipulated to present a biased or false view of the data.
- Misleading tactics include altering scales, omitting context, cherry-picking data, and using visual distortions to skew perception.
- Always question the source of the data, its intent, and how it has been massaged into the visual format presented to you.
- Learn to create honest and compelling charts that preserve integrity while telling an accurate story.
- Critical consumption of charts and data visualizations fosters better decision-making and prevents misinformation.
Famous Quotes from the Book
"A chart tells a story, but the storyteller decides how the tale unfolds."
"The smallest tweak to a line or bar can alter the perception of an audience—and therein lies the danger."
"Good visuals simplify the complex while staying true to the data. Misleading visuals simplify at the expense of truth."
Why This Book Matters
In today's world, data is omnipresent. From corporate reports to political campaigns and social media infographics, visuals are leveraged to influence opinions and decisions daily. Yet, with this increasing reliance on charts and graphs comes a heightened risk of misinformation and manipulation. "How to Lie with Charts" is essential reading because it not only increases awareness about this issue but also arms readers with the skills to critically evaluate what they see. It underscores the ethical responsibility of creators and the vigilance needed by consumers in the digital age.
For professionals, educators, students, and the everyday person, this book provides the knowledge necessary to navigate a world saturated with data. Gerald Everett Jones shines a light on both the creative and destructive power of visual storytelling, urging readers to think critically and act responsibly. In doing so, "How to Lie with Charts" becomes a timeless and vital resource.
دانلود رایگان مستقیم
شما میتونید سوالاتتون در باره کتاب رو از هوش مصنوعیش بعد از ورود بپرسید
دسترسی به کتابها از طریق پلتفرمهای قانونی و کتابخانههای عمومی نه تنها از حقوق نویسندگان و ناشران حمایت میکند، بلکه به پایداری فرهنگ کتابخوانی نیز کمک میرساند. پیش از دانلود، لحظهای به بررسی این گزینهها فکر کنید.
این کتاب رو در پلتفرم های دیگه ببینید
WorldCat به شما کمک میکنه تا کتاب ها رو در کتابخانه های سراسر دنیا پیدا کنید
امتیازها، نظرات تخصصی و صحبت ها درباره کتاب را در Goodreads ببینید
کتابهای کمیاب یا دست دوم را در AbeBooks پیدا کنید و بخرید
1307
بازدید4.0
امتیاز0
نظر98%
رضایتنظرات:
4.0
بر اساس 0 نظر کاربران
Questions & Answers
Ask questions about this book or help others by answering
No questions yet. Be the first to ask!




![Good Charts, Updated and Expanded: The HBR Guide to Making Smarter, More Persuasive Data Visualizations [Team-IRA]](https://s3.refhub.ir/images/thumb/Good_Charts__Updated_and_Expanded__The_HBR_Gu_31517.webp)
