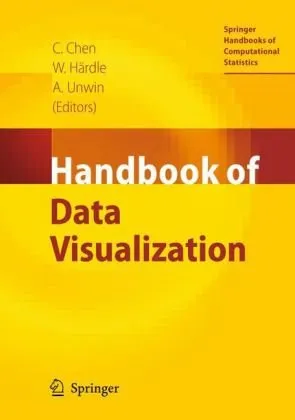
Handbook of Data Visualization (Springer Handbooks of Computational Statistics)
4.5
بر اساس نظر کاربران

شما میتونید سوالاتتون در باره کتاب رو از هوش مصنوعیش بعد از ورود بپرسید
هر دانلود یا پرسش از هوش مصنوعی 2 امتیاز لازم دارد، برای بدست آوردن امتیاز رایگان، به صفحه ی راهنمای امتیازات سر بزنید و یک سری کار ارزشمند انجام بدینکتاب های مرتبط:
معرفی کتاب 'Handbook of Data Visualization'
کتاب Handbook of Data Visualization که توسط 'Chun-houh Chen, Wolfgang Hardle, و Antony Unwin' ویرایش شده است، یکی از منابع جامع و ارزشمند در زمینه Data Visualization به شمار میرود. این کتاب بخشی از مجموعه مهم Springer Handbooks of Computational Statistics است که به پیچیدگیهای تحلیل داده و جلوههای بصری دادهها میپردازد. در دنیای امروزی که حجم دادهها بهطور تصاعدی در حال افزایش است، این کتاب بهعنوان چراغی راهنما برای پژوهشگران، تحلیلگران داده، طراحان و تصمیمگیران ایفای نقش میکند.
این کتاب با ترکیبی از محتوای نظری و کاربردی، یک منبع کلیدی برای درک معماری و اصول بنیادین Data Visualization است. با پرداختن به توزیعهای پیچیده، تکنیکهای dimensionality reduction و ابزارهای آماری، این اثر به کاربران کمک میکند دادهها را بهشکلی مؤثر بصریسازی کنند و بینشهای کاربردی از طریق آن به دست آورند. تمرکز این کتاب نه تنها بر ایجاد تصاویر جذاب بلکه بر انتقال اطلاعات دقیق و علمی نیز است.
خلاصهای جامع از کتاب
کتاب با معرفی اصول و مفاهیم پایهای شروع شده و در ادامه به تکنیکهای تخصصیتر مانند استفاده از روشهای Interactive Visualization و تکنیکهای High-dimensional Data Representation میپردازد. فصلهای مختلف این اثر به موضوعاتی همچون:
- بصریسازی توزیعهای آماری و دادههای پیچیده
- راهکارهای نوین Dynamic Visualization
- روشهای تعاملی برای کاوش دادهها
- کاربرد ابزارهای مدرن نرمافزاری و تحلیل
چرا این کتاب مهم است؟
دنیای امروز شاهد انفجار اطلاعات است و اهمیت توانایی تجزیه و تحلیل بصری دادهها روزبهروز بیشتر احساس میشود. این کتاب از این جهت حائز اهمیت است که فراتر از ارائه ابزارهای معمول بصریسازی، به مخاطبین کمک میکند تا بهجای کار صرف با نمودارها، بصریسازی را بهعنوان ابزاری تفکر و تصمیمگیری درک کنند. با تمرکز بر تکنیکهای مدرن و ابزارهای پیشرفته، این اثر برای پژوهشگران، متخصصین داده، و دانشجویان تحصیلات تکمیلی در زمینههای آمار، Data Science، و تحلیل داده بسیار مفید خواهد بود.
نکات کلیدی که در این کتاب خواهید آموخت
این کتاب شامل بسیاری از نکات کاربردی و اصولی در زمینه Data Visualization است که برخی از آنها عبارتند از:
- تکنیکهای نوآورانه برای تجسم دادههای پرحجم
- چگونگی شفافسازی دادهها برای انتقال موثر اطلاعات
- بهکارگیری نرمافزارهای R و Python برای ایجاد نمودارهای پویا
- راهکارهای ساخت بصریسازیهای چندبعدی برای دادههای پیچیده
- بررسی موردی از صنایع مختلف برای درک کاربردهای عملی
جملات معروف از کتاب
"Brevity and clarity are the essence of all good visualizations; they aim to reveal stories within the data, not obscure them."
"Visualizations serve as cognitive tools that help us think, learn, and communicate effectively with data."
این جملات به خوبی بیانگر فلسفه محوری کتاب هستند: کمک به برقراری ارتباط ساده و شفاف از طریق دادههای پیچیده.
جمعبندی
Handbook of Data Visualization یک منبع ضروری برای هرکسی است که علاقهمند به هنر و علم بصریسازی دادهها است. این کتاب نه تنها برای متخصصین بلکه برای تمامی افرادی که میخواهند با دادهها و تجزیه و تحلیل آنها ارتباطی عمیقتر برقرار کنند، یک راهنمای عالی به شمار میآید. ترکیب دیدگاه عملی و نظری آن باعث شده تا این اثر برای مخاطبین مختلف از دانشجویان دانشگاهی گرفته تا متخصصین شرکتهای تکنولوژی قابل استفاده باشد.
Introduction to "Handbook of Data Visualization"
The Handbook of Data Visualization is a comprehensive volume that delves into the art and science of visually representing data. As part of the acclaimed Springer Handbooks of Computational Statistics series, this book serves as an essential guide for statisticians, data scientists, and researchers across disciplines who aim to leverage visualization techniques to uncover patterns, communicate insights, and make data accessible. Co-edited by Chun-houh Chen, Wolfgang Härdle, and Antony Unwin, the book makes a compelling case for the central role that visualization plays in modern data analysis.
In an era marked by exponential growth in data generation, the ability to transform vast datasets into intuitive visuals is more important than ever. From statistical graphics to sophisticated multivariate visualizations, this handbook offers readers theoretical grounding coupled with practical applications, bringing together contributions from leading experts in the field. Packed with detailed descriptions, real-world case studies, and advanced methodologies, the book strikes a balance between accessibility and rigor, making it an indispensable resource for learners and practitioners alike.
Detailed Summary of the Book
The Handbook of Data Visualization is an expansive guide structured to address the fundamentals, innovations, and applications of data visualization. The book begins with a foundational overview of visualization concepts, introducing readers to key principles such as perceptual psychology, user interactivity, and interpretation challenges. As the chapters unfold, various visualization paradigms are explored in depth—including static and interactive visualizations, hierarchical and network visualizations, spatiotemporal representations, and software tools designed for visualization tasks.
Beyond the technical, the book emphasizes the interpretive aspect of data visualization. It integrates aspects of storytelling, design aesthetics, and decision-making, showcasing techniques that not only display data but make it comprehensible and actionable. A significant portion of the book is dedicated to case studies across domains such as finance, healthcare, and social science, highlighting how visualization bridges the gap between raw numbers and actionable insights.
What sets this book apart is its rigorous exploration of multivariate data visualization—a complex area that addresses data with multiple dimensions. Techniques like parallel coordinates, scatterplot matrices, and trellis plots are extensively discussed, providing readers with pragmatic approaches to handle high-dimensional datasets.
Key Takeaways
-
1. Interdisciplinary Perspective
Data visualization is presented as an intersection of statistics, computer science, and psychology, ensuring that readers understand its multifaceted nature.
-
2. Practical Applications
Readers gain exposure to practical tools and techniques tailored for real-world datasets across numerous domains.
-
3. Advanced Visualization Techniques
From interactive dashboards to dynamic visualizations, the book covers advanced concepts that are critical in modern analytics.
-
4. User-Centric Design
Focuses on designing visuals that are not only technically accurate but also user-friendly and engaging.
Famous Quotes from the Book
“Visualization is not just about making data look pretty—it’s about transforming information into understanding.”
“The best visualizations are those that reveal the unexpected and make patterns apparent.”
“Every dataset tells a story, and visualization is the key to unlocking it.”
Why This Book Matters
The significance of the Handbook of Data Visualization lies in its ability to bridge the gap between raw data and informed decision-making. As organizations increasingly recognize the importance of data-driven strategies, visuals have emerged as quintessential tools for communication and interpretation. However, effective visualization requires a nuanced understanding of both the underlying data and the audiences’ cognitive processes.
This book empowers readers to go beyond basic charts and graphs, equipping them with the skills to create compelling visuals that highlight trends, relationships, and outliers without sacrificing precision. The emphasis on multivariate data visualization, in particular, addresses a critical need for professionals handling complex datasets across fields like finance, medicine, and sociology.
By blending theory with practical application, this handbook not only serves as a technical reference but also fosters a deeper appreciation for the role of visualization in analytics. It is a must-read for anyone serious about mastering the art and science of data visualization in today’s data-centric world.
دانلود رایگان مستقیم
شما میتونید سوالاتتون در باره کتاب رو از هوش مصنوعیش بعد از ورود بپرسید
دسترسی به کتابها از طریق پلتفرمهای قانونی و کتابخانههای عمومی نه تنها از حقوق نویسندگان و ناشران حمایت میکند، بلکه به پایداری فرهنگ کتابخوانی نیز کمک میرساند. پیش از دانلود، لحظهای به بررسی این گزینهها فکر کنید.
این کتاب رو در پلتفرم های دیگه ببینید
WorldCat به شما کمک میکنه تا کتاب ها رو در کتابخانه های سراسر دنیا پیدا کنید
امتیازها، نظرات تخصصی و صحبت ها درباره کتاب را در Goodreads ببینید
کتابهای کمیاب یا دست دوم را در AbeBooks پیدا کنید و بخرید
1226
بازدید4.5
امتیاز0
نظر98%
رضایتنظرات:
4.5
بر اساس 0 نظر کاربران
Questions & Answers
Ask questions about this book or help others by answering
No questions yet. Be the first to ask!
