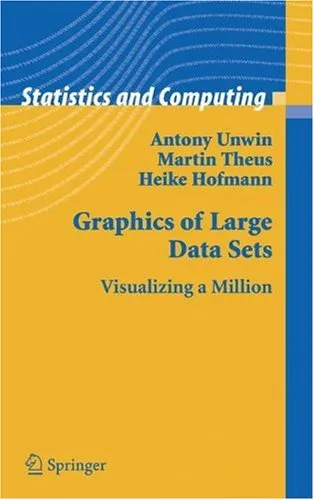
Graphics of Large Data Sets: Visualizing a Million
4.5
بر اساس نظر کاربران

شما میتونید سوالاتتون در باره کتاب رو از هوش مصنوعیش بعد از ورود بپرسید
هر دانلود یا پرسش از هوش مصنوعی 2 امتیاز لازم دارد، برای بدست آوردن امتیاز رایگان، به صفحه ی راهنمای امتیازات سر بزنید و یک سری کار ارزشمند انجام بدینکتاب های مرتبط:
معرفی کتاب: Graphics of Large Data Sets: Visualizing a Million
کتاب Graphics of Large Data Sets: Visualizing a Million نوشتهی Antony Unwin، یک مرجع بسیار مهم در حوزهی Data Visualization است که به نحوی جذاب و هدفمند روشهای تحلیل گرافیکی مجموعه دادههای بزرگ را توضیح میدهد. با توجه به رشد فزایندهی دادهها و حجم بیحد و حصر آنها در قرن بیست و یکم، این کتاب به منبعی کلیدی برای درک اصول و روشهای تصویری کردن دادههای حجیم تبدیل شده است.
خلاصهای از کتاب
این کتاب بر اساس ترکیبی از اصول تئوری و تمرینات عملی نوشتهشده و رویکردی جامع به نمایش گرافیکی دادههای بزرگ (Big Data) پیشنهاد میکند. نویسنده ابزارهای تحلیلی و تکنیکهای پیشرفتهای را معرفی میکند که به کمک آن میتوانیم از میان حجم عظیمی از دادهها، اطلاعات مفیدی استخراج کنیم. Graphics of Large Data Sets با تأکید بر تخصص در تحلیلهای گرافیکی به بررسی ابزارهایی مانند R، Matlab و حتی روشهای سنتیتر پرداخته است. تحلیلهای مرتبط با چندین جنبه از دادهها مانند خلاصه سازی، شناسایی الگوها، دستهبندی و کشف همبستگیها به طور عمیق در کتاب شرح داده شده است.
یکی از ویژگیهای برجستهی این کتاب، استفاده از محدودیتهای حقیقی در مدیریت دادههای بزرگ و ارائه راهحلهایی مبتنی بر بصریسازی هوشمندانه است. این رویکرد باعث میشود که حتی کاربرانی که تخصص زیادی در برنامهنویسی یا مدلسازی ندارند، نیز بتوانند با دادههای پیچیده کار کنند.
نکات کلیدی
- آشنایی با ابزارهای قدرتمند بصریسازی برای کار با دادههای بسیار حجیم
- راهکارهای شناسایی الگوها و ناهنجاریها در مجموعه دادههای پیچیده
- معرفی تکنیکهای پیشرفته برای خلاصهسازی و معرفی دادههای چندبعدی
- مطالعهی کاربردی روی پروژههای واقعی با استفاده از مجموعه دادههای واقعی
- تأکید بر رویکردهای سیستمی در تحلیل دادهها و استفاده از ابزارهایی مانند R و GGplot2
نقلقولهای معروف از کتاب
“Graphics are not just for presentation, but for understanding the structure and stories within data.”
“A well-designed visualization can reveal facts in data that would otherwise remain hidden.”
اهمیت این کتاب
اهمیت کتاب Graphics of Large Data Sets: Visualizing a Million در زمینهای است که در آن دادهها محور تصمیمگیری ابزارهای پیشرفته و استراتژیهای کسب و کار قرار گرفتهاند. قابلیت درک صحیح از دادهها و استفاده بهینه از آنها دیگر یک نیاز ثانویه نیست، بلکه یک مهارت ضروری در دنیای امروز به شمار میآید. این کتاب نه تنها به افراد حرفهای داده، بلکه به دانشجویان، پژوهشگران و تصمیمگیران نیز ابزارهایی ارائه میدهد که میتوانند از طریق آنها به ارزش واقعی اطلاعات دست یابند.
علاوه بر این، برجستگی این کتاب در توضیحات ساده و رویکرد تعاملی آن است. حتی اگر خواننده تجربهی زیادی در کار با Data Visualization نداشته باشد، این کتاب دانش و مهارت لازم را به او میدهد. بدین گونه این اثر برای حوزههای مختلفی از جمله علم داده، آمار، بازاریابی، و حتی علوم اجتماعی مورد استفاده قرار میگیرد.
Introduction
In today's data-driven world, we are surrounded by increasingly vast amounts of information, often measured in terabytes or even petabytes. While advanced computational infrastructures and algorithms have been developed to process large-scale data, making sense of such volumes still presents unique challenges. This is where the power of visualization comes into focus: condensing millions of data points into meaningful, interpretable, and actionable insights. "Graphics of Large Data Sets: Visualizing a Million" is a comprehensive exploration of how visualization tools and techniques can tackle the challenges posed by exceptionally large datasets. Written by Antony Unwin, a pioneering figure in data visualization, this book does not just present technical solutions but also emphasizes the art and science of communicating complex patterns effectively.
Whether you are an academic, data scientist, statistician, or visualization enthusiast, this book serves as an indispensable resource for anyone interested in mastering the art of visualizing "big data." With a focus on approaching large datasets innovatively and practically, it combines theoretical concepts, real-world applications, and inspiring examples to guide readers through the process of data visualization.
Detailed Summary of the Book
"Graphics of Large Data Sets: Visualizing a Million" delves into the challenges and possibilities of creating visual representations for massive datasets. Unlike traditional statistical tasks, working with millions of data points requires innovative approaches to ensure both clarity and relevance. The book begins with foundational principles of statistical graphics, discussing what makes a visualization effective, informative, and engaging.
As the chapters progress, the book introduces strategies for dealing with overwhelming volumes of data, such as data reduction techniques, sampling methods, and aggregation strategies. It highlights the importance of understanding the audience's needs and tailoring visualizations accordingly. Furthermore, it explores specific visualization types—such as scatterplots, heatmaps, treemaps, and parallel coordinates—showing their strengths and limitations when working with extensive datasets.
Through rich examples and case studies, the book provides practical insights into how to approach common big data problems in fields ranging from business intelligence to genetics data analysis. From dealing with overplotting to constructing visually appealing summaries, the text offers thoroughly tested methods for making sense of complex data. The use of R, one of the most popular programming languages for data visualization, is also covered in multiple contexts, though the approaches are language-agnostic and broadly applicable.
Key Takeaways
- Understanding the principles of effective data visualization and design.
- Techniques for managing overplotting and high data densities in graphics.
- Practical strategies for reducing data scales without losing critical information.
- Insights and tools for working with millions of data points in domains from social sciences to machine learning.
- Best practices for integrating statistical thinking into visualization workflows.
- Case studies that illustrate the real-world application of visualization techniques on large datasets.
Famous Quotes from the Book
"Big data doesn’t just demand processing power; it demands visual clarity to uncover its narratives."
"A great visualization not only reveals what is there but also challenges us to see what we may have overlooked."
"Simplifying millions of observations into one image is a craft—an art grounded in mathematics, creativity, and intuition."
Why This Book Matters
"Graphics of Large Data Sets: Visualizing a Million" occupies a unique position in the fields of data science and visual analytics, addressing the often-overlooked nuances of working with truly massive datasets. While many books focus on generic visualization principles, few provide the depth of understanding needed to deal with the specific challenges of high-volume data. This book matters because it combines technical rigor with creative problem-solving, offering solutions that go beyond superficial design choices.
As we continue to generate data on an unprecedented scale, the ability to visualize such information becomes increasingly critical in fields ranging from climate science to finance. The insights presented in this book empower readers to transform raw, complex data into structured, meaningful graphics that drive better decision-making, research, and communication.
By emphasizing the interplay of artistry and statistical rigor, Antony Unwin introduces readers to a new way of thinking about data visualization. This is not just a book to read but a practical guide to implementing techniques that will change how you approach your datasets forever.
دانلود رایگان مستقیم
شما میتونید سوالاتتون در باره کتاب رو از هوش مصنوعیش بعد از ورود بپرسید
دسترسی به کتابها از طریق پلتفرمهای قانونی و کتابخانههای عمومی نه تنها از حقوق نویسندگان و ناشران حمایت میکند، بلکه به پایداری فرهنگ کتابخوانی نیز کمک میرساند. پیش از دانلود، لحظهای به بررسی این گزینهها فکر کنید.
این کتاب رو در پلتفرم های دیگه ببینید
WorldCat به شما کمک میکنه تا کتاب ها رو در کتابخانه های سراسر دنیا پیدا کنید
امتیازها، نظرات تخصصی و صحبت ها درباره کتاب را در Goodreads ببینید
کتابهای کمیاب یا دست دوم را در AbeBooks پیدا کنید و بخرید
1339
بازدید4.5
امتیاز0
نظر98%
رضایتنظرات:
4.5
بر اساس 0 نظر کاربران
Questions & Answers
Ask questions about this book or help others by answering
No questions yet. Be the first to ask!
