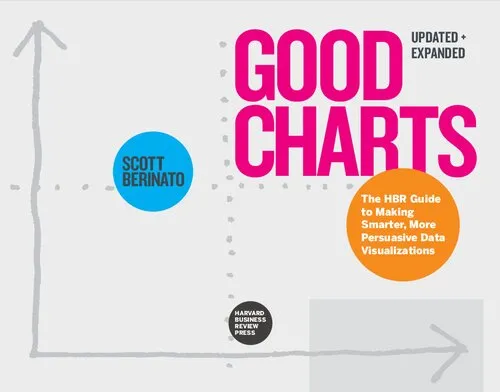
Good Charts,: The HBR Guide to Making Smarter, More Persuasive Data Visualizations
4.5
بر اساس نظر کاربران

شما میتونید سوالاتتون در باره کتاب رو از هوش مصنوعیش بعد از ورود بپرسید
هر دانلود یا پرسش از هوش مصنوعی 2 امتیاز لازم دارد، برای بدست آوردن امتیاز رایگان، به صفحه ی راهنمای امتیازات سر بزنید و یک سری کار ارزشمند انجام بدینکتاب های مرتبط:
معرفی کتاب "Good Charts"
کتاب "Good Charts: The HBR Guide to Making Smarter, More Persuasive Data Visualizations" یکی از منابع ارزشمند برای افرادی است که میخواهند دادههای خود را به شکل مؤثر و متقاعدکننده به تصویر بکشند. این کتاب توسط اسکات بریناتو نوشته شده و به خوانندگان ابزاری برای طراحی دادهنماهای زیبا، کاربردی و تأثیرگذار ارائه میدهد. این کتاب مناسب برای کسانی است که در دنیای تحلیل دادهها، کسبوکار یا حتی طراحی تعاملی فعالیت دارند.
خلاصهای از کتاب
در این کتاب، اسکات بریناتو به بررسی فرآیند طراحی، تحلیل و ارائه Data Visualization میپردازد. او معتقد است که هر کسی توانایی طراحی دادهنماهای مؤثر را دارد، به شرط آنکه اصول آن را یاد بگیرد. این کتاب با ترکیب مثالهای دنیای واقعی، ابزارهای عملی و نظریات کارشناسی، به خواننده کمک میکند از طراحیهای ساده و ناخوانا فاصله گرفته و دادهنماهایی خلق کند که پیامی واضح و ماندگار داشته باشند.
کتاب به چهار بخش اصلی تقسیمبندی شده است:
- نگرش پایه به Data Visualization
- اصول طراحی هوشمندانه و زیباسازی
- رویکردی مبتنی بر داستانسرایی در طراحی دادهنماها
- چگونه از ابزارهای مدرن و تکنولوژی برای بهبود طراحی استفاده کنیم
نکات کلیدی کتاب
برخی از مفاهیم مهمی که در این کتاب بررسی میشوند عبارتند از:
- تفاوت بین زیبایی و کارآمدی در طراحی دادهنماها
- تأثیر Narrative و داستانسرایی در فهم بهتر دادهها
- استفاده از اصول Gestalt در طراحی بصری
- اهمیت مخاطبشناسی در طراحی Data Visualization
اسکات بریناتو به صورت کاربردی نشان میدهد که چگونه میتوان تعادلی بین پیچیدگی دادهها و شفافیت پیام برقرار کرد.
جملات برجسته از کتاب
"Good design is not about making things pretty, it's about making things understandable."
"The best charts don’t just show data—they tell a story."
"Visualization should make the complicated simple, not the simple complicated."
چرا این کتاب مهم است؟
دنیای امروز پر از دادههایی است که نیاز به تحلیل و فهم عمیق دارند. با توجه به پیچیدگی دادهها، نیاز به ابزارهایی برای سادهسازی و ارائه واضح آنها بیش از هر زمان دیگری احساس میشود. کتاب "Good Charts" به عنوان راهنمایی جامع، مخصوصاً برای تیمهای کسبوکار، تحلیلگران داده و حتی رهبران سازمانی طراحی شده است. کاربردی بودن مثالها و ساختار منظم آن باعث میشود این کتاب به ابزاری ارزشمند برای درک ضرورت Data Visualization پیشرفته تبدیل شود.
این کتاب به خواننده کمک میکند تا تأثیرگذاری بیشتری در ارائههای خود داشته باشد و قادر باشد پیامِ دادههای خود را به روشی مؤثر و ماندگار منتقل کند. به زبان ساده، "Good Charts" به شما یاد میدهد که چگونه دادهها را به صحبت بیاورید.
Introduction to "Good Charts: The HBR Guide to Making Smarter, More Persuasive Data Visualizations"
In an era dominated by data, the ability to communicate effectively through visual storytelling has become a crucial skill, whether you're presenting in a meeting, delivering a keynote, or building a business case. "Good Charts: The HBR Guide to Making Smarter, More Persuasive Data Visualizations," authored by Scott Berinato, is a comprehensive guide designed to demystify the process of creating impactful data visualizations. The book is tailored for professionals and leaders who want to elevate their data storytelling prowess and connect with their audience on a deeper level.
Unlike traditional resources that only focus on tools and techniques, this book delves into the principles behind effective visuals. It examines how to craft visuals that not only look good but also make data meaningful and compelling. Scott Berinato introduces a framework that helps readers think critically about their design choices, ensuring their charts and graphics convey the right story in the right way. From understanding how people process visual information to mastering the nuances of design, "Good Charts" paves the way for both beginners and seasoned professionals to create visualizations that leave a lasting impression.
Detailed Summary of the Book
"Good Charts" begins by addressing a critical insight: making sense of data is not just about crunching numbers; it's about telling a story. The book highlights the importance of moving beyond basic charts and templates—towards crafting visualizations that resonate emotionally and deliver data-driven arguments effectively. It introduces the concept of "chart literacy," empowering readers to analyze and evaluate data visualizations with a critical eye.
The book is structured in a way that guides readers through the progression of visualization mastery. It starts with the basics of how the human brain interprets visual stimuli and gradually moves into practical frameworks for creating visuals. Concepts such as clarity, aesthetics, and actionability are emphasized. Berinato also discusses the role of empathy in design, focusing on understanding the needs and preferences of your audience.
Through real-world examples and case studies, the book illustrates how even the simplest visual choices can influence perception. It challenges the reader to rethink common practices and embrace experimentation. Furthermore, readers are encouraged to view their charts as tools for persuasion, grounding their designs in purpose and intentionality.
Key Takeaways
- Understand how human cognition and design intersect to create impactful visuals.
- Learn to approach data visualization with empathy, focusing on your audience's needs.
- Break away from default charting options to create unique, thoughtful visuals.
- Master the art of visual storytelling by blending aesthetics with functionality.
- Evaluate and critique charts effectively using a structured framework.
- Create charts that are not just visually appealing but also actionable and persuasive.
Famous Quotes from the Book
"Good charts make us think, and they feel effortless to engage with."
"The goal of visualization is not to show data, but to show insight."
"Design isn't just decoration; it's about crafting meaning."
These quotes capture the essence of the book, reinforcing the idea that truly effective visualizations are a blend of art and science. They inspire the reader to approach chart-making not as a mechanical task but as an opportunity to create meaningful impact.
Why This Book Matters
"Good Charts" matters because it addresses a widespread issue that affects industries worldwide: the inability to communicate data effectively. In today’s fast-paced and data-driven environment, the significance of clear, compelling communication cannot be overstated. While many professionals focus on data extraction and analysis, Berinato's book advocates for the critical last step—the delivery of insight in a way that engages and persuades.
This book is not just an instructional manual; it’s a call to rethink how we approach visual communication. It equips professionals with the mindset and tools necessary to elevate their data visualizations, ensuring their messages cut through the noise and drive meaningful action. Whether you're a manager, a designer, or an analyst, "Good Charts" provides timeless lessons that are as relevant in the boardroom as they are in the classroom.
By focusing on both the art and science of visualization, Scott Berinato has created a resource that goes beyond technical know-how, helping readers cultivate a deeper connection with their audience through the power of visual storytelling.
دانلود رایگان مستقیم
شما میتونید سوالاتتون در باره کتاب رو از هوش مصنوعیش بعد از ورود بپرسید
دسترسی به کتابها از طریق پلتفرمهای قانونی و کتابخانههای عمومی نه تنها از حقوق نویسندگان و ناشران حمایت میکند، بلکه به پایداری فرهنگ کتابخوانی نیز کمک میرساند. پیش از دانلود، لحظهای به بررسی این گزینهها فکر کنید.
این کتاب رو در پلتفرم های دیگه ببینید
WorldCat به شما کمک میکنه تا کتاب ها رو در کتابخانه های سراسر دنیا پیدا کنید
امتیازها، نظرات تخصصی و صحبت ها درباره کتاب را در Goodreads ببینید
کتابهای کمیاب یا دست دوم را در AbeBooks پیدا کنید و بخرید
1370
بازدید4.5
امتیاز0
نظر98%
رضایتنظرات:
4.5
بر اساس 0 نظر کاربران
Questions & Answers
Ask questions about this book or help others by answering
No questions yet. Be the first to ask!
