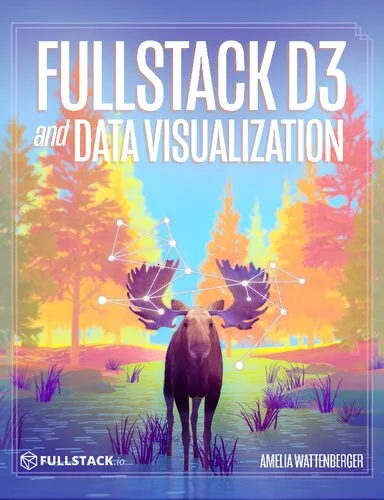
Fullstack Data Visualization with D3 Build Beautiful Data Visualizations and Dashboards with D3
4.6
بر اساس نظر کاربران

شما میتونید سوالاتتون در باره کتاب رو از هوش مصنوعیش بعد از ورود بپرسید
هر دانلود یا پرسش از هوش مصنوعی 2 امتیاز لازم دارد، برای بدست آوردن امتیاز رایگان، به صفحه ی راهنمای امتیازات سر بزنید و یک سری کار ارزشمند انجام بدینکتاب های مرتبط:
معرفی کتاب
کتاب "Fullstack Data Visualization with D3 Build Beautiful Data Visualizations and Dashboards with D3" نوشتهی املیا واتنبرگر یک منبع جامع برای توسعهدهندگان و طراحانی است که میخواهند مهارتهای خود در زمینه بصریسازی دادهها با D3.js را ارتقا دهند.
خلاصهای از کتاب
این کتاب به شما قدرت میدهد تا دادهها را به صورت نمودارها، گرافها و داشبوردهای تعاملی درآورید. با استفاده از D3.js، کتاب راهنمایی جامع برای تحلیلگران داده، توسعهدهندگان و طراحانی است که میخواهند با زبان JavaScript و کتابخانهی D3 دادهها را بازنمایی کنند.
در سراسر کتاب، شما به یادگیری مفاهیم پایه JavaScript و چگونگی تغییر دادهها به تصاویر مفهومی میپردازید. این مطالب شما را قادر میسازد تا از پروژههای کوچک شروع کرده و به سمت ساخت داشبوردهای پیچیده و کاربردی حرکت کنید.
نکات کلیدی
- درک عمیق از D3.js و استفاده آن در بصریسازی دادهها
- یادگیری نحوه ساخت داشبوردهای تعاملی با دادههای واقعی
- آشنایی با الگوهای طراحی و پیادهسازی در وب
- افزایش توانایی در ساختن رابطهای کاربری حرفهای با Stack کامل
نقل قولهای مشهور از کتاب
”هر بصریسازی خوب، داستانی را روایت میکند و دادهها را به گونهای مطرح میکند که برای بیننده معنادار باشد.“
”D3.js ابزاری قدرتمند است که با آن میتوان نه تنها دادهها را نمایش داد، بلکه به عمق دادهها نفوذ کرد.“
چرا این کتاب مهم است؟
با رشد سریع حجم دادهها و نیاز به بصریسازی پیچیدهتر، درک عمیق از ابزارهایی مانند D3.js بیشتر از همیشه ضروری شده است. این کتاب راهنمایی فنی و عملی برای کسانی است که میخواهند دادهها را به روشی جذاب و قابل فهم در اختیار مخاطبان خود قرار دهند. همچنین، روشهای ذکر شده در کتاب به توسعهدهندگان کمک میکند تا دیدگاههای منحصر به فرد در پروژههای خود ارائه دهند.
Introduction
Welcome to "Fullstack Data Visualization with D3: Build Beautiful Data Visualizations and Dashboards with D3," your comprehensive guide to mastering the art and science of data visualization using the D3.js library. Whether you're a data scientist, web developer, or simply someone fascinated by the power of turning numbers into stories, this book provides the expertise and insights to elevate your skills in crafting visually stunning and insightful data visualizations.
Detailed Summary of the Book
This book is a deep dive into the world of data visualization with a focus on practical applications using D3.js, a powerful JavaScript library that allows developers to create highly customizable visual data representations on the web. Throughout the book, you will be guided through the process of understanding data, choosing the right type of visualization, and implementing it in a way that best conveys the underlying insights.
The journey begins with an introduction to the fundamental concepts of data visualization, setting the stage for why visualization matters in today's data-driven world. As you proceed, you'll encounter in-depth chapters dedicated to the mechanics of D3.js, covering everything from basic selections and data binding to more complex topics like scales, axes, and visual transitions.
Each chapter builds on the last, introducing new concepts and techniques that progressively enhance your ability to manage and visualize data. You'll explore methods for creating various types of graphs, such as bar charts, scatter plots, and line graphs, all while utilizing the full capabilities of D3 to create interactive and dynamic visualizations. By the end of the book, you will not only have mastered the technical skills required to use D3.js but also acquired a deep understanding of how to tell compelling stories through data.
Key Takeaways
- Understand the principles of data visualization and its impact on modern communication.
- Gain hands-on experience with D3.js, from basic to advanced techniques.
- Learn to create various types of data visualizations, including basic charts and complex interactive dashboards.
- Master the art of storytelling through data by integrating narrative with visual elements.
- Enhance your web applications with engaging data-driven visual components.
Famous Quotes from the Book
"Data visualization is not just about creating beautiful charts—it's about making data meaningful and accessible."
"D3.js is not just a tool; it's a canvas for your data creativity."
Why This Book Matters
In a world where data is ubiquitous yet often overwhelming, "Fullstack Data Visualization with D3" stands out as an essential resource for anyone looking to harness the power of data through visual means. This book matters because it bridges the gap between raw data and perception, providing a framework for transforming complex datasets into crisp, clear visual stories that can influence decision-making, drive innovation, and inspire change.
Data Visualization is integral in industries ranging from business intelligence to healthcare, finance, and beyond. With this book, you're not just learning about creating charts; you are acquiring a skillset essential for the digital age where visual data understanding becomes a key competitive advantage.
دانلود رایگان مستقیم
شما میتونید سوالاتتون در باره کتاب رو از هوش مصنوعیش بعد از ورود بپرسید
دسترسی به کتابها از طریق پلتفرمهای قانونی و کتابخانههای عمومی نه تنها از حقوق نویسندگان و ناشران حمایت میکند، بلکه به پایداری فرهنگ کتابخوانی نیز کمک میرساند. پیش از دانلود، لحظهای به بررسی این گزینهها فکر کنید.
این کتاب رو در پلتفرم های دیگه ببینید
WorldCat به شما کمک میکنه تا کتاب ها رو در کتابخانه های سراسر دنیا پیدا کنید
امتیازها، نظرات تخصصی و صحبت ها درباره کتاب را در Goodreads ببینید
کتابهای کمیاب یا دست دوم را در AbeBooks پیدا کنید و بخرید
1314
بازدید4.6
امتیاز0
نظر98%
رضایتنظرات:
4.6
بر اساس 0 نظر کاربران
Questions & Answers
Ask questions about this book or help others by answering
No questions yet. Be the first to ask!
