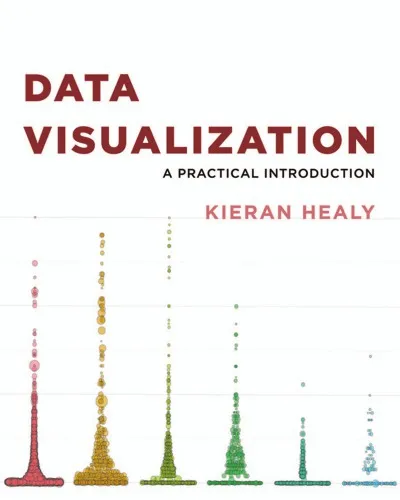
Data Visualization: A Practical Introduction
4.5
بر اساس نظر کاربران

شما میتونید سوالاتتون در باره کتاب رو از هوش مصنوعیش بعد از ورود بپرسید
هر دانلود یا پرسش از هوش مصنوعی 2 امتیاز لازم دارد، برای بدست آوردن امتیاز رایگان، به صفحه ی راهنمای امتیازات سر بزنید و یک سری کار ارزشمند انجام بدینکتاب های مرتبط:
معرفی اجمالی کتاب
کتاب "Data Visualization: A Practical Introduction" اثر کیران هیلی، یک منبع برجسته در حوزه تجسم داده است که به شیوهای عملی و قابل فهم، مفاهیم پیچیده تجسم داده را برای خوانندگان توضیح میدهد. این کتاب با استفاده از زبان R و ابزارهایی مانند ggplot2، روشهای گوناگونی را برای ایجاد نمودارهای مؤثر و جذاب بیان میکند.
در این کتاب، هیلی به کاوش در تکنیکهای مختلف تجسم داده میپردازد که کمک میکند تا دادهها را به صورت بصری درک کرده و تحلیل کنیم. او با بهرهگیری از مثالهای عملی و گام به گام، مفاهیم پایهای و پیشرفته مرتبط با تجسم داده را بهگونهای بههمپیوسته توضیح میدهد که از مبتدیان تا متخصصان داده میتوانند از آن بهرهمند شوند.
نکات کلیدی کتاب
- آشنایی با اصول پایهای تجسم داده و اهمیت آن در تحلیلهای دادهمحور
- یادگیری نحوه استفاده از ggplot2 در R برای ایجاد نمودارهای متنوع و مؤثر
- فهم عیوب و خطاهای متداول در تجسم داده و چگونگی اجتناب از آنها
- آشنایی با چگونگی بهبود و ارتقاء تجسمها برای جلب توجه و ایجاد تاثیر بیشتر
نقلقولهای معروف از کتاب
در اینجا به برخی از نقلقولهای مهم از کتاب اشاره میکنیم که برجستگی آن را نشان میدهند:
«تجسم داده بیشتر از هر چیز دیگری هنر تحریف اطلاعات است؛ وظیفه ما بهعنوان طراح، انتخاب تحریفهایی است که پیامهای واقعی و معنادار را به تصویر بکشند.»
«هر نمودار داستانی را بیان میکند. اگر داستانی نداریم که به مخاطب منتقل کنیم، تجسم داده بیفایده میشود.»
چرا این کتاب مهم است
در دنیای امروز که دادهها همهجا حضور دارند، توانایی تحلیل و ارائه یافت دادههای معنادار یک مهارت اساسی محسوب میشود. کتاب "Data Visualization: A Practical Introduction" به دلیل رویکرد عملی و جامع در تدریس تکنیکهای تجسم داده، به عنوان یک منبع مهم آموزشی شناخته میشود. هیلی با زبان ساده و روشن خود، مفاهیم پیچیده و پیشرفته را به روشهایی قابل دسترس تبدیل کرده است که میتواند ابزار مفیدی برای پژوهشگران، تحلیلگران داده و هر کسی که نیاز به ارائه بصری دادهها دارد، باشد.
این کتاب به گونهای طراحی شده که علاوه بر آموزش مهارتهای فنی، به خوانندگان کمک میکند تا تفکر خلاقانه و انتقادی نسبت به استفاده از دادهها و تجسم آنها در دنیای واقعی داشته باشند؛ چرا که در تجسم داده، زیبایی و دقت به طور همزمان از اهمیت فوقالعادهای برخوردارند. این کتاب فرصت مناسبی برای یادگیری از یک متخصص در این حوزه و ارتقاء تواناییهای شما در تجسم داده است.
Introduction
"Data Visualization: A Practical Introduction" is a comprehensive guide that delves into the art and science of presenting data in a clear, concise, and visually appealing manner. Written by Kieran Healy, an expert in data presentation, this book is an invaluable resource for anyone who wants to learn the fundamentals of data visualization using the R programming language. The book is structured to cater to both beginners and those with some experience in the field, making it an essential tool for data analysts, researchers, and anyone interested in turning raw data into compelling stories.
Detailed Summary of the Book
The book begins by explaining the importance of data visualization, highlighting its role in making complex data accessible and understandable. Healy emphasizes the importance of thinking about one's audience and the message one wants to convey with data. The book uses the R library ggplot2, which is praised for its versatility and power in creating various types of plots and charts. Each chapter builds on the previous one, introducing new concepts and techniques in a logical and structured manner.
Kieran Healy covers the basics of R and ggplot2 in the initial chapters, providing readers with a foundation in setting up their environment and understanding the grammar of graphics. The book then progresses to more advanced topics, such as manipulating data, understanding scales, creating polished plots, and customizing visualization elements to suit specific needs.
Through practical examples and real-world datasets, Healy ensures that readers get hands-on experience in applying what they've learned. He also offers insight into the best practices of data visualization, guiding readers on how to avoid common pitfalls and to approach visualization with a critical eye.
Key Takeaways
- Understand the fundamental principles of effective data visualization.
- Learn to use the R programming language and ggplot2 library for creating clear and engaging visualizations.
- Gain practical experience through hands-on examples and exercises.
- Develop the ability to critically analyze and improve your visualizations.
Famous Quotes from the Book
"Good data visualization helps you understand your data and yourself, better."
"The best visualizations are not just for showing what's clear, but for making clear what is hard to see."
Why This Book Matters
Data visualization is an essential skill in today's data-driven world. Whether you're a business professional, academic, or researcher, the ability to convey complex information visually can significantly impact your work. "Data Visualization: A Practical Introduction" is not just a textbook; it is a toolkit for anyone looking to enhance their understanding and communication of data.
Healy's clear and engaging writing style, combined with his practical approach, makes this book a must-read for those looking to deepen their knowledge of data visualization. The use of real-world examples and exercises allows readers to apply what they have learned in concrete ways, bridging the gap between theory and practice.
Moreover, Kieran Healy's insights into the common challenges of data visualization and his emphasis on clarity and truthfulness in data presentation make this book highly relevant for anyone concerned with the ethical dimensions of data representation. By mastering the strategies outlined in this book, readers are better equipped to create thoughtful and effective visualizations in any professional field.
دانلود رایگان مستقیم
شما میتونید سوالاتتون در باره کتاب رو از هوش مصنوعیش بعد از ورود بپرسید
دسترسی به کتابها از طریق پلتفرمهای قانونی و کتابخانههای عمومی نه تنها از حقوق نویسندگان و ناشران حمایت میکند، بلکه به پایداری فرهنگ کتابخوانی نیز کمک میرساند. پیش از دانلود، لحظهای به بررسی این گزینهها فکر کنید.
این کتاب رو در پلتفرم های دیگه ببینید
WorldCat به شما کمک میکنه تا کتاب ها رو در کتابخانه های سراسر دنیا پیدا کنید
امتیازها، نظرات تخصصی و صحبت ها درباره کتاب را در Goodreads ببینید
کتابهای کمیاب یا دست دوم را در AbeBooks پیدا کنید و بخرید
1485
بازدید4.5
امتیاز0
نظر98%
رضایتنظرات:
4.5
بر اساس 0 نظر کاربران
Questions & Answers
Ask questions about this book or help others by answering
No questions yet. Be the first to ask!
