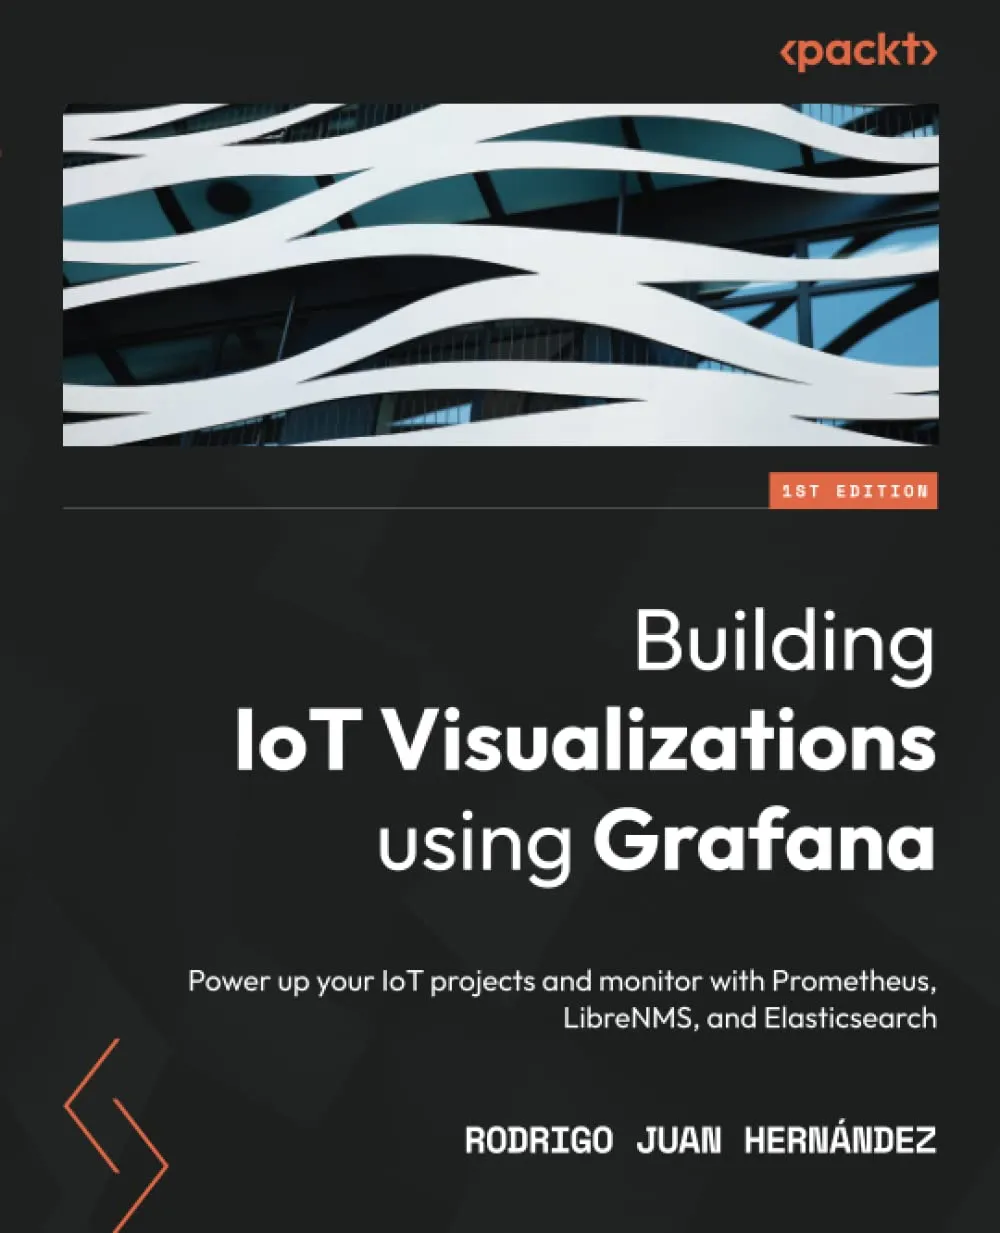
Building IoT Visualizations using Grafana: Power up your IoT projects and monitor with Prometheus, LibreNMS, and Elasticsearch
4.3
بر اساس نظر کاربران

شما میتونید سوالاتتون در باره کتاب رو از هوش مصنوعیش بعد از ورود بپرسید
هر دانلود یا پرسش از هوش مصنوعی 2 امتیاز لازم دارد، برای بدست آوردن امتیاز رایگان، به صفحه ی راهنمای امتیازات سر بزنید و یک سری کار ارزشمند انجام بدینکتاب های مرتبط:
Persian Summary
معرفی کتاب
کتاب Building IoT Visualizations using Grafana نوشته رودریگو خوان هرناندز، یک منبع ضروری برای توسعهدهندگان و علاقهمندان به اینترنت اشیا محسوب میشود. این کتاب با استفاده از ابزارهای پیشرفته نظارت و تجسم اطلاعات، به شما کمک میکند تا پروژههای IoT خود را به سطح بالاتری برسانید.
خلاصهای از کتاب
این کتاب به صورت جامع و کاربردی به معرفی ابزارهای بنیادین مانند Grafana، Prometheus، LibreNMS و Elasticsearch میپردازد. هر کدام از این ابزارها قابلیتهای ویژهای در زمینه نظارت و تحلیلات داده در پروژههای IoT ارائه میکنند. خواننده با مطالعه این کتاب، مهارت استفاده از این ابزارها برای بهینهسازی و تجسم دادههای IoT را به دست خواهد آورد.
در فصلهای ابتدایی، مقدمهای بر اهمیت نظارت و مدیریت دادهها در IoT ارایه میشود. سپس، به بررسی ویژگیهای منحصر به فرد هر کدام از ابزارهای یاد شده پرداخته و نحوه استفاده موثر از آنها توضیح داده میشود. در نهایت، مثالهای عملی و پروژههای واقعی برای استفاده کاربردی از این دانش آورده شده است.
نکات کلیدی
- درک عمیق از مفاهیم پایه در نظارت و تجزیه و تحلیل دادههای IoT.
- یادگیری استفاده از Grafana برای ایجاد داشبوردهای تعاملی و زیبا.
- آشنایی با Prometheus برای نظارت بر عملکرد و مقیاسپذیری سیستمها.
- کاربرد LibreNMS در جمعآوری و مصورسازی دادههای شبکه.
- نحوه استفاده از Elasticsearch برای بهینهسازی جستجو و نمایش دادهها.
جملات مشهور از کتاب
"توانایی تجسم دادههای IoT به روشی موثر، تفاوت میان کاربرد محض و نوآوری معنادار را مشخص میکند."
"استفاده از Grafana، مانند داشتن یک بوم خالی است که تنها محدودیت آن خلاقیت شماست."
چرا این کتاب مهم است
توسعه مداوم و روزافزون فناوریهای IoT به معنای نیاز به ابزارها و دانش جدید برای نظارت و مدیریت بهینه این سیستمها است. این کتاب با تاکید بر تجسم دادهها و استفاده پرکاربرد از ابزارهایی چون Grafana و Prometheus، امکان ایجاد پروژههای پویاتر و موثرتر را فراهم میآورد. اگر به دنبال راهی برای ارتقای تواناییهای خود در مدیریت و تجزیه و تحلیل دادههای IoT هستید، این کتاب برای شما نوشته شده است.
علاوه بر این، سبک نگارش واضح و مثالهای عملی ارائه شده در این کتاب، آن را به منبعی کاربردی برای توسعهدهندگان حرفهای و نوآوران حوزه IoT تبدیل کرده است. به واسطه این کتاب، میتوانید پروژههای خود را به سطح جدیدی از کارایی و تاثیرگذاری ارتقا دهید.
Welcome to the comprehensive guide to mastering IoT visualizations with the power of Grafana. This book, "Building IoT Visualizations using Grafana: Power up your IoT projects and monitor with Prometheus, LibreNMS, and Elasticsearch," is your gateway to understanding and implementing robust monitoring solutions for Internet of Things (IoT) deployments. Designed for both beginners and experienced developers, this book provides step-by-step instructions and expert insights into creating dynamic and informative dashboard solutions.
Detailed Summary of the Book
In an era where data reigns supreme, the need for effective data visualization tools to interpret IoT data has never been more pressing. This book delves into the world of Grafana, an open-source platform that allows for the effective analysis and visualization of IoT data. It guides you through the installation, configuration, and operation of Grafana, focusing on its integration with Prometheus, LibreNMS, and Elasticsearch. Through practical examples and illustrative scenarios, you learn how to harness these powerful tools to maximize the potential of your IoT systems.
The journey begins with an introduction to Grafana's capabilities, interfaces, and ecosystem, followed by a deep dive into Prometheus for data scraping, aggregation, and alerting. You will then explore LibreNMS, an open-source network monitoring tool, perfect for network-based IoT infrastructures. The book further enhances your skillset with Elasticsearch, helping you manage and analyze large volumes of data with ease. By the end of this book, you will be proficient in creating real-time IoT visualizations that provide actionable insights.
Key Takeaways
- Mastery of Grafana for creating interactive and dynamic IoT dashboards.
- Proficiency in integrating Prometheus for effective time-series data management and alerting.
- Ability to utilize LibreNMS for robust network monitoring and manage IoT deployments efficiently.
- Deep understanding of Elasticsearch for handling and analyzing large datasets seamlessly.
- Capability to construct meaningful visual representations of complex IoT data for enhanced decision-making.
Famous Quotes from the Book
"Data is only valuable when it can drive actionable insights. With Grafana, Prometheus, LibreNMS, and Elasticsearch, you can transform raw IoT data into a strategic asset."
"The goal of IoT visualization is not just to display numbers and charts, but to tell a story that leads to informed decision-making and innovation."
Why This Book Matters
The exponential growth of IoT has significantly increased the volume and variety of data, creating a demand for sophisticated visualization and monitoring tools. This book is crucial for anyone involved in IoT projects who needs to ensure their systems are both efficient and transparent. It stands out by providing a complete roadmap—from understanding IoT visualization basics to implementing advanced monitoring strategies using the leading open-source tools.
Moreover, as businesses and industries leverage IoT to gain competitive advantages, the ability to visualize IoT data effectively becomes a critical skill. Whether you are an entrepreneur, a systems architect, or an IoT enthusiast, this book equips you with the necessary tools and knowledge to confront the challenges of modern IoT landscapes, ensuring you remain at the forefront of this technological revolution.
دانلود رایگان مستقیم
شما میتونید سوالاتتون در باره کتاب رو از هوش مصنوعیش بعد از ورود بپرسید
دسترسی به کتابها از طریق پلتفرمهای قانونی و کتابخانههای عمومی نه تنها از حقوق نویسندگان و ناشران حمایت میکند، بلکه به پایداری فرهنگ کتابخوانی نیز کمک میرساند. پیش از دانلود، لحظهای به بررسی این گزینهها فکر کنید.
این کتاب رو در پلتفرم های دیگه ببینید
WorldCat به شما کمک میکنه تا کتاب ها رو در کتابخانه های سراسر دنیا پیدا کنید
امتیازها، نظرات تخصصی و صحبت ها درباره کتاب را در Goodreads ببینید
کتابهای کمیاب یا دست دوم را در AbeBooks پیدا کنید و بخرید
5299
بازدید4.3
امتیاز0
نظر98%
رضایتنظرات:
4.3
بر اساس 0 نظر کاربران
Questions & Answers
Ask questions about this book or help others by answering
No questions yet. Be the first to ask!
