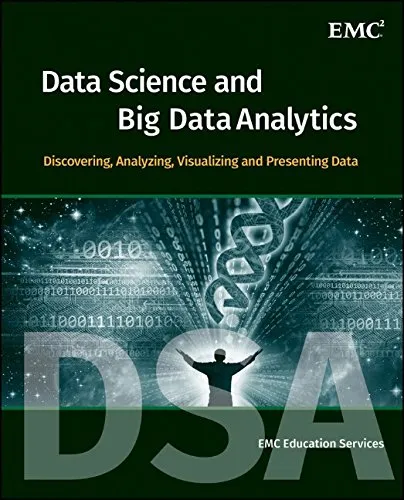
Data Science and Big Data Analytics: Discovering, Analyzing, Visualizing and Presenting Data
EMC Education Services
2015
View book
Book guide and evaluation
Polley, David E.;Börner, Katy
0 reviews
Published
pages
views
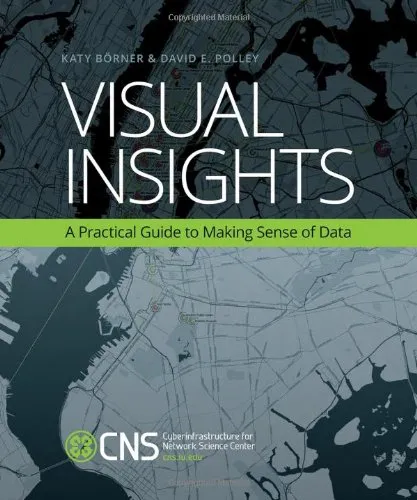
Introduction to "Visual Insights: A Practical Guide to Making Sense of Data" In today's data-driven world, the ability to effectively interpret and communicate data has never been more essential. "Visual Insights: A Practical Guide to Making Sense of Data" by Polley, David
Before you read
In today's data-driven world, the ability to effectively interpret and communicate data has never been more essential. "Visual Insights: A Practical Guide to Making Sense of Data" by Polley, David E. and Börner, Katy is a must-read guidebook for anyone looking to master the art of data visualization. The book takes readers through a comprehensive journey, from understanding raw data to transforming it into meaningful insights that can inform decision-making, spark innovation, and inspire action.
The authors, both of whom have been at the forefront of data science and visualization, provide a clear roadmap for navigating the complex landscape of data. With its rich content, actionable advice, and practical examples, this book equips readers with the tools they need to decode data and present it in visually compelling ways. It is not just a manual for technical experts but a resource for anyone who wants to make data more accessible and impactful, regardless of their background.
"Visual Insights" offers readers a balanced blend of theory and practical advice. The book covers a wide range of topics, making it equally valuable to beginners and seasoned professionals. Each chapter builds on the last, ensuring a structured and logical progression through the material. Below are the major themes explored in the book:
From foundational concepts like selecting the right chart type to advanced techniques like interactive dashboards, the book offers something for everyone. The authors also explore the ethical considerations of data visualization and emphasize the importance of integrity and transparency when presenting data.
By the end of this book, readers will have a robust understanding of data visualization and will be equipped to tackle real-world challenges. Here are some key takeaways:
"Visual Insights" is filled with insightful observations and memorable quotes. Here are some highlights:
"Data by itself is just a collection of numbers. It's the insights we derive from data that truly matter."
"The most successful visualizations don’t just make data beautiful; they make it meaningful."
"Clarity should always take precedence over complexity in data presentation—it’s the key to effective communication."
"Visual Insights" is more than just a guide to data visualization; it’s a roadmap for making sense of the vast amounts of data that permeate every facet of modern life. In an era where information overload is the norm, the ability to distill complex datasets into clear, actionable insights is a critical skill. This book makes that process not only approachable but rewarding.
The authors' expertise shines through in every chapter, offering readers both a strong theoretical foundation and practical tools they can use immediately. The emphasis on ethics and storytelling elevates the book beyond a technical manual, making it relevant and useful for professionals in business, science, education, and government.
In short, "Visual Insights" is an indispensable resource for anyone who wants to transform raw data into something that can educate, persuade, and inspire. It’s a book that bridges the gap between data science and communication, making it a vital resource for the challenges of the 21st century.
Your question is answered in the context of this title and author. Each answer uses 2 points.
0 reviews, 4.5 average out of 5
Sign in to publish a review.
Ask a focused question and learn from the community.
Related references that continue this learning path.
EMC Education Services