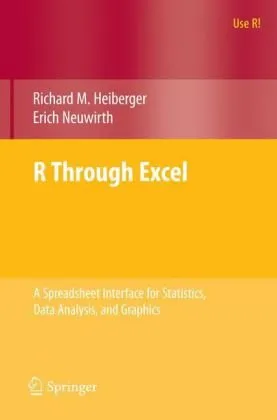
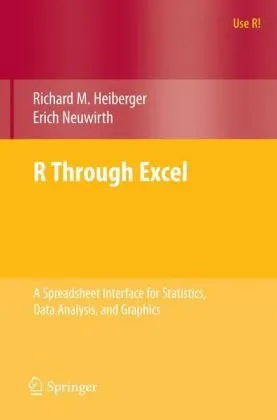
R Through Excel: A Spreadsheet Interface for Statistics, Data Analysis, and Graphics
Richard M. Heiberger,Erich Neuwirth (auth.)
2009
View book
Book guide and evaluation
Bill Jelen
0 reviews
Published
pages
views
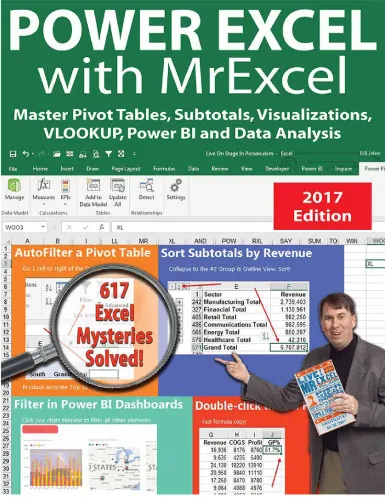
Power excel 2016 with mrexcel : Master Pivot Tables, Subtotals, Charts, VLOOKUP, IF, Data Analysis in Excel 2010–2013Excel data analysis techniques, Pivot Tables masteryDiscover Power excel 2016 with mrexcel for expert guidance on Pivot Tables, Charts, VLOOKUP, IF, and Excel data
Before you read
The book Power excel 2016 with mrexcel : Master Pivot Tables, Subtotals, Charts, VLOOKUP, IF, Data Analysis in Excel 2010–2013 serves as an indispensable guide for professionals, academics, and data-driven enthusiasts aiming to push Microsoft Excel beyond its perceived limits. Authored by Bill Jelen—widely known as “MrExcel”—this publication synthesizes years of applied experience and comprehensive instruction into an actionable reference for tackling real-world data challenges. The content bridges gap between casual spreadsheet use and master-level proficiency, making it a resource equally valuable in corporate, educational, and research contexts.
Structured logically, the book walks readers through core Excel capabilities, starting from foundational operations such as Subtotals and proceeding to advanced constructs like Pivot Tables, sophisticated charting techniques, and critical Excel formulas such as VLOOKUP and IF statements. By contextualizing each function within relevant datasets and practical scenarios, it ensures the reader doesn’t just learn commands, but understands their strategic applications. The coverage extends across Excel versions 2010 to 2013, acknowledging both continuity and subtle evolutions in the software’s ecosystem.
While the exact publication year is information unavailable due to no reliable public source, the work remains timely as many organizations still rely on these versions and their robust capabilities. Readers will find the methods and insights adaptable, even if newer versions are in use, given Excel’s backward compatibility and consistent core functionalities.
From mastering Pivot Tables to harnessing the precision of logical formulas, this book empowers the modern analyst to turn raw data into meaningful strategy. It is not about memorizing menu paths; it is about cultivating an analytical mindset anchored in Excel’s vast toolkit.
Key learning outcomes include: a thorough comprehension of chart creation and customization, strategic deployment of Subtotals for rapid aggregation, crafting of robust data models with VLOOKUP and IF, and leveraging Pivot Tables for deep, multidimensional analysis. Each topic is illustrated in a manner accessible to both seasoned professionals and motivated newcomers.
"A Pivot Table is not just a tool—it’s your command center for the data battlefield."Unknown
"In Excel, formulas are language; learn to speak them fluently, and data becomes dialogue."Unknown
"Efficiency in spreadsheets is less about speed, more about precision and foresight."Unknown
In the data-rich world of contemporary decision-making, the ability to process, interpret, and visualize information is a differentiator. This book equips readers with precisely that edge.
With Excel being a cornerstone across industries—from finance and engineering to education and public policy—the techniques inside are universally transferrable. By focusing on both the mechanics and the logic behind Excel functions, the book fosters enduring competency rather than fleeting familiarity. For academics, it offers structured pathways to teach advanced spreadsheet analytics; for professionals, it delivers time-tested methods to streamline reporting, enhance insights, and justify decisions with clarity. Mastering Pivot Tables, VLOOKUP, and charting as illustrated here is an investment that directly translates to career growth and organizational efficiency.
The journey through Power excel 2016 with mrexcel : Master Pivot Tables, Subtotals, Charts, VLOOKUP, IF, Data Analysis in Excel 2010–2013 is a journey toward mastery—a commitment to see data differently and act accordingly.
Whether your aim is to conquer complex datasets, streamline reporting processes, or cultivate a more agile approach to analytics, the strategies you will gain here are transformative. Bill Jelen’s authoritative guidance blends technical precision with practical wisdom, ensuring that every feature of Excel—from Subtotals to advanced charting—not only becomes usable, but indispensable. Now is the time to dive in, absorb the lessons, and apply them to your projects. Read the book, share its insights with peers, and discuss its concepts widely; because the power to excel lies in deliberate learning and consistent application.
Your question is answered in the context of this title and author. Each answer uses 2 points.
0 reviews, 4.6 average out of 5
Sign in to publish a review.
Ask a focused question and learn from the community.
Related references that continue this learning path.
Richard M. Heiberger,Erich Neuwirth (auth.)
Richard M. Heiberger,Erich Neuwirth (auth.)