Book guide and evaluation
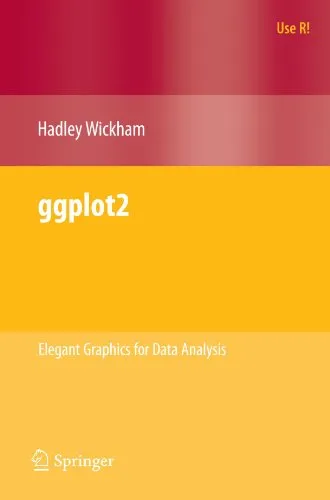
ggplot2: Elegant Graphics for Data Analysis
Hadley Wickham (auth.)
English
Beginner
Artificial Intelligence (AI)
4.3 / 5
0 reviews
2009
Published
222
pages
411
views
This book describes ggplot2, a new data visualization package for R that uses the insights from Leland Wilkison's Grammar of Graphics to create a powerful and flexible system for creating data graphics. With ggplot2, it's easy to:produce handsome, publication-quality plots, with
Before you read
What will you get from this book?
This book describes ggplot2, a new data visualization package for R that uses the insights from Leland Wilkison's Grammar of Graphics to create a powerful and flexible system for creating data graphics. With ggplot2, it's easy to:produce handsome, publication-quality plots, with automatic legends created from the plot specificationsuperpose multiple layers (points, lines, maps, tiles, box plots to name a few) from different data sources, with automatically adjusted common scalesadd customisable smoothers that use the powerful modelling capabilities of R, such as loess, linear models, generalised additive models and robust regressionsave any ggplot2 plot (or part thereof) for later modification or reusecreate custom themes that capture in-house or journal style requirements, and that can easily be applied to multiple plotsapproach your graph from a visual perspective, thinking about how each component of the data is represented on the final plotThis book will be useful to everyone who has struggled with displaying their data in an informative and attractive way. You will need some basic knowledge of R (i.e. you should be able to get your data into R), but ggplot2 is a mini-language specifically tailored for producing graphics, and you'll learn everything you need in the book. After reading this book you'll be able to produce graphics customized precisely for your problems, and you'll find it easy to get graphics out of your head and on to the screen or page.Hadley Wickham is an Assistant Professor of Statistics at Rice University, and is interested in developing computational and cognitive tools for making data preparation, visualization, and analysis easier. He has developed 15 R packages and in 2006 he won the John Chambers Award for Statistical Computing for his work on the ggplot and reshape R packages.
Ask this book
Your question is answered in the context of this title and author. Each answer uses 2 points.
Sign in to ask the book assistant.
Reader reviews
0 reviews, 4.3 average out of 5
No reviews yet
If you have read this book, help the next reader with your experience.
Write a review
Sign in to publish a review.
Reader questions and answers
Ask a focused question and learn from the community.
Sign in to ask or answer a question.
No questions yet
Be the first to ask a clear, useful question.
What to read next
Related references that continue this learning path.
Metaprogramming in R: Advanced Statistical Programming for Data Science, Analysis and Finance
Thomas Mailund (auth.)
2017
View book