Book guide and evaluation
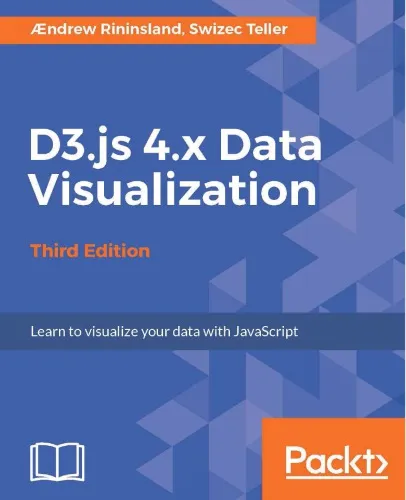
D3.js 4.x data visualization : learn to visualize your data with JavaScript
AEndrew Rininsland;Swizec Teller
English
Beginner
NoSQL
4.0 / 5
0 reviews
2017
Published
300
pages
420
views
Detailed Summary of the Book “D3.js 4.x Data Visualization: Learn to Visualize Your Data with JavaScript” is a comprehensive guide for both beginners and experienced practitioners seeking to master the art of data visualization using D3.js, an incredibly powerful yet com
Before you read
What will you get from this book?
Detailed Summary of the Book
“D3.js 4.x Data Visualization: Learn to Visualize Your Data with JavaScript” is a comprehensive guide for both beginners and experienced practitioners seeking to master the art of data visualization using D3.js, an incredibly powerful yet complex JavaScript library.
The book delves into the intricacies of D3.js 4.x — a library that allows you to bind arbitrary data to a Document Object Model (DOM) and then apply data-driven transformations to the document. D3 offers immense flexibility with an emphasis on web standards, enabling full capabilities over the final visual output. Throughout the chapters, you'll encounter a variety of real-world examples and projects which are thoroughly explained to enhance your learning experience.
Readers will start with the basics of setting up their environments and understanding the foundational concepts necessary for creating basic visualizations. The book covers crucial techniques such as scales, axes, and selections which build the backbone of D3.js. As you progress, you'll explore in-depth coverage of topics like transitions, animations, shapes, and layouts.
Moreover, more advanced topics are systematically introduced, such as: hierarchical layouts, force layouts, and geographic maps powered by D3’s powerful geospatial tools. By the end of the book, you will also have gained proficiency in debugging and optimizing visualizations, making your applications not only impactful but also efficient and performant.
Key Takeaways
- Understand the full capabilities and the power of D3.js for creating data-driven visualizations.
- Gain skills to implement intricate visual transformations and animations that bring life to your data.
- Learn best practices, debugging techniques, and optimization strategies for high-performance visualizations.
- Develop the ability to apply web standards and leverage the DOM effectively for dynamic visual storytelling.
- Rich real-world examples that demonstrate the application of D3.js in varied contexts, enhancing practical understanding.
Famous Quotes from the Book
“Data visualization is not just about clarity — it’s an art form unto itself, capable of conveying deep insights through compelling narratives.”
“Mastery of D3.js gives you the keys to unleash the potential of the web as a canvas for your imagination.”
Why This Book Matters
In a world increasingly driven by data, the ability to visualize complex datasets effectively and intuitively is more indispensable than ever. “D3.js 4.x Data Visualization” stands out as a vital resource within the landscape of data visualization literature for a few notable reasons.
The book is tailored for a diverse audience, making it just as suitable for beginners grappling with the basics as for seasoned developers aiming to refine their skills and develop more sophisticated visualizations. The focus on real-world applications over abstract theory ensures that readers gain practical, applicable skills.
Moreover, the emphasis on modern web standards and the seamless integration with the DOM that D3.js facilitates means that readers will not only learn to create compelling visuals but also build them in a way that ensures maximum compatibility and efficiency on the web.
Importantly, this book settles amidst the ever-evolving pace of web technologies, striking a balance between depth and approachability. Readers come away with not only technical skills but also a deeper appreciation for the potential of data visualization as a discipline.
Ask this book
Your question is answered in the context of this title and author. Each answer uses 2 points.
Sign in to ask the book assistant.
Reader reviews
0 reviews, 4.0 average out of 5
No reviews yet
If you have read this book, help the next reader with your experience.
Write a review
Sign in to publish a review.
Reader questions and answers
Ask a focused question and learn from the community.
Sign in to ask or answer a question.
No questions yet
Be the first to ask a clear, useful question.
What to read next
Related references that continue this learning path.